Holiday Inn 2012 Annual Report Download - page 29
Download and view the complete annual report
Please find page 29 of the 2012 Holiday Inn annual report below. You can navigate through the pages in the report by either clicking on the pages listed below, or by using the keyword search tool below to find specific information within the annual report.-
 1
1 -
2
-
3
-
4
-
5
-
6
-
7
-
8
-
9
-
10
-
11
-
12
-
13
-
14
-
15
-
16
-
17
-
18
-
 19
19 -
 20
20 -
 21
21 -
 22
22 -
 23
23 -
 24
24 -
 25
25 -
 26
26 -
 27
27 -
 28
28 -
 29
29 -
 30
30 -
 31
31 -
 32
32 -
 33
33 -
 34
34 -
 35
35 -
 36
36 -
 37
37 -
 38
38 -
 39
39 -
40
-
41
-
42
-
43
-
44
-
45
-
46
-
47
-
48
-
49
-
50
-
51
-
52
-
53
-
54
-
55
-
56
-
57
-
58
-
59
-
60
-
61
-
62
-
63
-
64
-
65
-
66
-
67
-
68
-
69
-
70
-
71
-
72
-
73
-
74
-
75
-
76
-
77
-
78
-
79
-
80
-
81
-
82
-
83
-
84
-
85
-
86
-
87
-
88
-
89
-
90
-
91
-
92
-
93
-
94
-
95
-
96
-
97
-
98
-
99
-
100
-
101
-
102
-
103
-
104
-
105
-
106
-
107
-
108
-
109
-
110
-
111
-
112
-
113
-
114
-
115
-
116
-
117
-
118
-
119
-
120
-
121
-
122
-
123
-
124
-
125
-
126
-
127
-
128
-
129
-
130
-
131
-
132
-
133
-
134
-
135
-
136
-
137
-
138
-
139
-
140
-
141
-
142
-
143
-
144
 |
 |

Performance 27
OVERVIEW BUSINESS REVIEW GOVERNANCE
GROUP FINANCIAL
STATEMENTS
PARENT COMPANY
FINANCIAL STATEMENTS OTHER INFORMATION
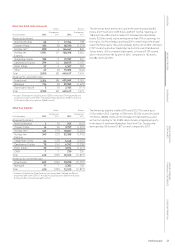
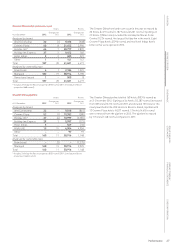
Greater China hotel and room count
Hotels Rooms
At 31 December 2012
Change over
2011 2012
Change over
2011
Analysed by brand
InterContinental 22 (1) 9,373 (538)
Crowne Plaza 60 821,452 2,996
Holiday Inn* 64 720,777 2,839
Holiday Inn Express 37 39,453 760
Hotel Indigo 32405 221
Other 11141 141
Total 187 20 61,601 6,419
Analysed by ownership type
Franchised 412,184 1,221
Managed 182 19 58,914 5,190
Owned and leased 1–503 8
Total 187 20 61,601 6,419
* Includes 3 Holiday Inn Resort properties (893 rooms) (2011: 2 Holiday Inn Resort
properties (668 rooms)).
Greater China pipeline
Hotels Rooms
At 31 December 2012
Change over
2011 2012
Change over
2011
Analysed by brand
InterContinental 22 –9,018 (861)
Crowne Plaza 52 (1) 19,332 (380)
Holiday Inn* 37 (4) 10,999 (2,381)
Holiday Inn Express 29 15,997 (221)
Hotel Indigo 5–569 (10)
HUALUXE 15 15 4,904 4,904
Other ––97 97
Total 160 11 50,916 1,148
Analysed by ownership type
Franchised –(2) –(1,375)
Managed 160 13 50,916 2,523
Total 160 11 50,916 1,148
* Includes 3 Holiday Inn Resort properties (850 rooms) (2011: 5 Holiday Inn Resort
properties (1,468 rooms)).
The Greater China hotel and room count in the year increased by
20 hotels (6,419 rooms) to 187 hotels (61,601 rooms). Openings of
23 hotels (7,584 rooms) included the Holiday Inn Macao Cotai
Central (1,224 rooms), the largest Holiday Inn in the world. Eight
Crowne Plaza hotels (2,996 rooms) and two Hotel Indigo hotels
(224 rooms) were opened in 2012.
The Greater China pipeline totalled 160 hotels (50,916 rooms) as
at 31 December 2012. Signings of 46 hotels (13,387 rooms) increased
from 38 hotels (12,112 rooms) in 2011 and included 15 hotels for the
newly launched HUALUXE Hotels & Resorts brand, together with
12 Crowne Plaza hotels (4,527 rooms). 12 hotels (4,655 rooms)
were removed from the pipeline in 2012. The pipeline increased
by 11 hotels (1,148 rooms) compared to 2011.