Holiday Inn 2012 Annual Report Download - page 117
Download and view the complete annual report
Please find page 117 of the 2012 Holiday Inn annual report below. You can navigate through the pages in the report by either clicking on the pages listed below, or by using the keyword search tool below to find specific information within the annual report.-
 1
1 -
2
-
3
-
4
-
5
-
6
-
7
-
8
-
9
-
10
-
11
-
12
-
13
-
14
-
15
-
16
-
17
-
18
-
19
-
20
-
21
-
22
-
23
-
24
-
25
-
26
-
27
-
28
-
29
-
30
-
31
-
32
-
33
-
34
-
35
-
36
-
37
-
38
-
39
-
40
-
41
-
42
-
43
-
44
-
45
-
46
-
47
-
48
-
49
-
50
-
51
-
52
-
53
-
54
-
55
-
56
-
57
-
58
-
59
-
60
-
61
-
62
-
63
-
64
-
65
-
66
-
67
-
68
-
69
-
70
-
71
-
72
-
73
-
74
-
75
-
76
-
77
-
78
-
79
-
80
-
81
-
82
-
83
-
84
-
85
-
86
-
87
-
88
-
89
-
90
-
91
-
92
-
93
-
94
-
95
-
96
-
97
-
98
-
99
-
100
-
101
-
102
-
103
-
104
-
105
-
106
-
 107
107 -
 108
108 -
 109
109 -
 110
110 -
 111
111 -
 112
112 -
 113
113 -
 114
114 -
 115
115 -
 116
116 -
 117
117 -
 118
118 -
 119
119 -
 120
120 -
 121
121 -
 122
122 -
 123
123 -
 124
124 -
 125
125 -
 126
126 -
 127
127 -
128
-
129
-
130
-
131
-
132
-
133
-
134
-
135
-
136
-
137
-
138
-
139
-
140
-
141
-
142
-
143
-
144
 |
 |

OVERVIEW BUSINESS REVIEW GOVERNANCE
GROUP FINANCIAL
STATEMENTS
PARENT COMPANY
FINANCIAL STATEMENTS OTHER INFORMATION
Notes to the Group Financial Statements 115
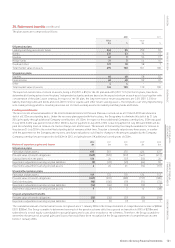
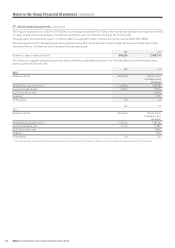
21. Financial risk management continued
The following table reconciles movements in instruments classified as Level 3 during the year:
2012 2011
$m $m
At 1 January 97 84
Additions – 1
Repaid (1) (3)
Valuation (losses)/ gains recognised in other comprehensive income (2) 16
Impairment* – (1)
At 31 December 94 97
* The impairment charge recognised in the income statement in 2011 (see note 5) included $2m of losses reclassified from equity.
The Level 3 equity securities relate to investments in unlisted shares which are valued by applying an average price-earnings (P/E) ratio for
a competitor group to the earnings generated by the investment or by reference to share of net assets. A 10% increase in the average P/E
ratio would result in a $5m increase (2011 $5m) in the fair value of the investments and a 10% decrease in the average P/E ratio would
result in a $5m decrease (2011 $5m) in the fair value of the investments. A 10% increase in net assets would result in a $2m increase
(2011 $3m) in the fair value of the investments and a 10% decrease in net assets would result in a $2m decrease (2011 $3m) in the fair
value of the investments.
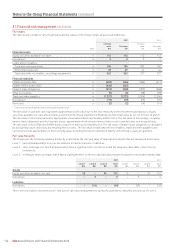
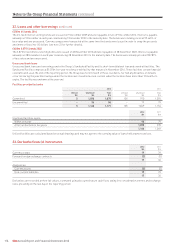
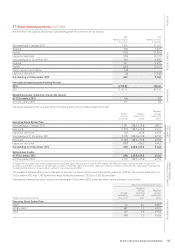
22. Loans and other borrowings
2012 2011
Current Non-current Total Current Non-current Total
$m $m $m $m $m $m
Secured bank loans – 5 5 5 – 5
Finance lease obligations 16 196 212 16 193 209
£250m 6% bonds 2016 – 403 403 – 384 384
£400m 3.875% bonds 2022 – 638 638 – – –
Unsecured bank loans – – – – 93 93
Total borrowings 16 1,242 1,258 21 670 691
Denominated in the following currencies:
Sterling – 1,041 1,041 – 384 384
US dollars 16 196 212 16 286 302
Other – 5 5 5 – 5
16 1,242 1,258 21 670 691
Secured bank loans
The New Zealand dollar mortgage is secured on the hotel property to which it relates.
Non-current amounts include $5m (2011 $nil) repayable by instalments.
Finance lease obligations
Finance lease obligations, which relate to the 99-year lease (of which 93 years remain) on the InterContinental Boston, are payable
as follows:
2012 2011
Minimum Present Minimum Present
lease value of lease value of
payments payments payments payments
$m $m $m $m
Less than one year 16 16 16 16
Between one and five years 64 48 64 48
More than five years 3,316 148 3,332 145
3,396 212 3,412 209
Less: amount representing finance charges (3,184) – (3,203) –
212 212 209 209
The Group has the option to extend the term of the lease for two additional 20-year terms. Payments under the lease step up at regular
intervals over the lease term.