Holiday Inn 2012 Annual Report Download - page 106
Download and view the complete annual report
Please find page 106 of the 2012 Holiday Inn annual report below. You can navigate through the pages in the report by either clicking on the pages listed below, or by using the keyword search tool below to find specific information within the annual report.-
 1
1 -
2
-
3
-
4
-
5
-
6
-
7
-
8
-
9
-
10
-
11
-
12
-
13
-
14
-
15
-
16
-
17
-
18
-
19
-
20
-
21
-
22
-
23
-
24
-
25
-
26
-
27
-
28
-
29
-
30
-
31
-
32
-
33
-
34
-
35
-
36
-
37
-
38
-
39
-
40
-
41
-
42
-
43
-
44
-
45
-
46
-
47
-
48
-
49
-
50
-
51
-
52
-
53
-
54
-
55
-
56
-
57
-
58
-
59
-
60
-
61
-
62
-
63
-
64
-
65
-
66
-
67
-
68
-
69
-
70
-
71
-
72
-
73
-
74
-
75
-
76
-
77
-
78
-
79
-
80
-
81
-
82
-
83
-
84
-
85
-
86
-
87
-
88
-
89
-
90
-
91
-
92
-
93
-
94
-
95
-
 96
96 -
 97
97 -
 98
98 -
 99
99 -
 100
100 -
 101
101 -
 102
102 -
 103
103 -
 104
104 -
 105
105 -
 106
106 -
 107
107 -
 108
108 -
 109
109 -
 110
110 -
 111
111 -
 112
112 -
 113
113 -
 114
114 -
 115
115 -
 116
116 -
117
-
118
-
119
-
120
-
121
-
122
-
123
-
124
-
125
-
126
-
127
-
128
-
129
-
130
-
131
-
132
-
133
-
134
-
135
-
136
-
137
-
138
-
139
-
140
-
141
-
142
-
143
-
144
 |
 |
104 IHG Annual Report and Financial Statements 2012
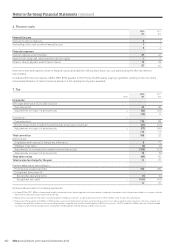
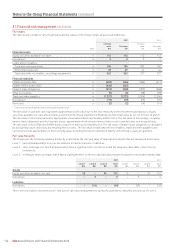
9. Earnings per ordinary share
Basic earnings per ordinary share is calculated by dividing the profit for the year available for IHG equity holders by the weighted average
number of ordinary shares, excluding investment in own shares, in issue during the year.
Diluted earnings per ordinary share is calculated by adjusting basic earnings per ordinary share to reflect the notional exercise of the
weighted average number of dilutive ordinary share options outstanding during the year.
Adjusted earnings per ordinary share is disclosed in order to show performance undistorted by exceptional items, to give a more
meaningful comparison of the Group’s performance.
Continuing and total operations 2012 2011
Basic earnings per ordinary share
Profit available for equity holders ($m) 544 460
Basic weighted average number of ordinary shares (millions) 287 289
Basic earnings per ordinary share (cents) 189.5 159.2
Diluted earnings per ordinary share
Profit available for equity holders ($m) 544 460
Diluted weighted average number of ordinary shares (millions) 292 296
Diluted earnings per ordinary share (cents) 186.3 155.4
Adjusted earnings per ordinary share
Profit available for equity holders ($m) 544 460
Adjusting items (note 5):
Exceptional operating items ($m) 4 (35)
Tax on exceptional operating items ($m) (1) (5)
Exceptional tax credit ($m) (141) (43)
Adjusted earnings ($m) 406 377
Basic weighted average number of ordinary shares (millions) 287 289
Adjusted earnings per ordinary share (cents) 141.5 130.4
Adjusted diluted earnings per ordinary share
Adjusted earnings ($m) 406 377
Diluted weighted average number of ordinary shares (millions) 292 296
Adjusted diluted earnings per ordinary share (cents) 139.0 127.4
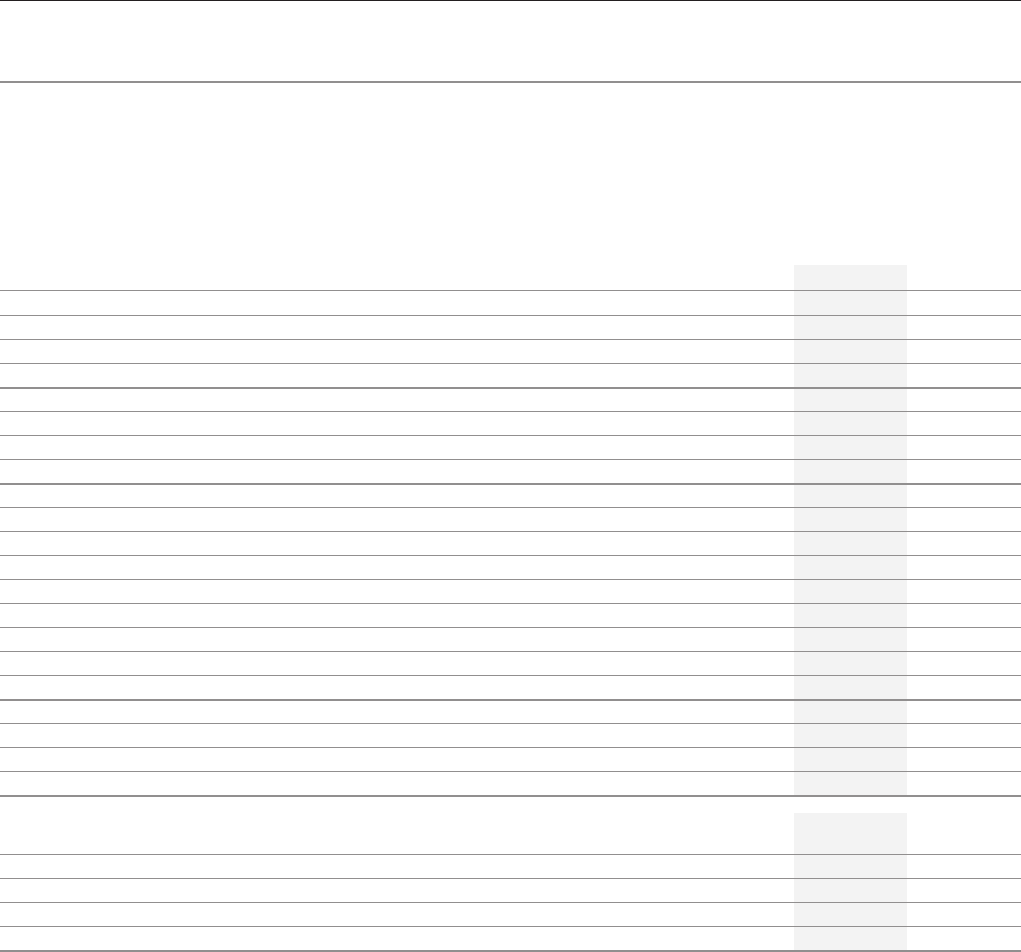
2012 2011
millions millions
Diluted weighted average number of ordinary shares is calculated as:
Basic weighted average number of ordinary shares 287 289
Dilutive potential ordinary shares – employee share options 5 7
292 296
Notes to the Group Financial Statements continued