Holiday Inn 2012 Annual Report Download - page 12
Download and view the complete annual report
Please find page 12 of the 2012 Holiday Inn annual report below. You can navigate through the pages in the report by either clicking on the pages listed below, or by using the keyword search tool below to find specific information within the annual report.-
 1
1 -
 2
2 -
 3
3 -
 4
4 -
 5
5 -
 6
6 -
 7
7 -
 8
8 -
 9
9 -
 10
10 -
 11
11 -
 12
12 -
 13
13 -
 14
14 -
 15
15 -
 16
16 -
 17
17 -
 18
18 -
 19
19 -
 20
20 -
 21
21 -
 22
22 -
23
-
24
-
25
-
26
-
27
-
28
-
29
-
30
-
31
-
32
-
33
-
34
-
35
-
36
-
37
-
38
-
39
-
40
-
41
-
42
-
43
-
44
-
45
-
46
-
47
-
48
-
49
-
50
-
51
-
52
-
53
-
54
-
55
-
56
-
57
-
58
-
59
-
60
-
61
-
62
-
63
-
64
-
65
-
66
-
67
-
68
-
69
-
70
-
71
-
72
-
73
-
74
-
75
-
76
-
77
-
78
-
79
-
80
-
81
-
82
-
83
-
84
-
85
-
86
-
87
-
88
-
89
-
90
-
91
-
92
-
93
-
94
-
95
-
96
-
97
-
98
-
99
-
100
-
101
-
102
-
103
-
104
-
105
-
106
-
107
-
108
-
109
-
110
-
111
-
112
-
113
-
114
-
115
-
116
-
117
-
118
-
119
-
120
-
121
-
122
-
123
-
124
-
125
-
126
-
127
-
128
-
129
-
130
-
131
-
132
-
133
-
134
-
135
-
136
-
137
-
138
-
139
-
140
-
141
-
142
-
143
-
144
 |
 |

10 IHG Annual Report and Financial Statements 2012
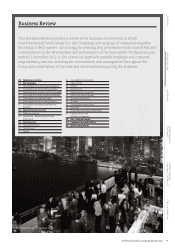
The hotel industry performed well last year despite challenging economic conditions. The economic outlook deteriorated over the course of
2012 with increased concerns over the Eurozone and weaker performance in the US and China. Global Domestic Product (GDP) increased by
2.3 per cent in 2012, compared with 2.9 per cent in 2011 and the year ended with a continued uncertain outlook across the globe.
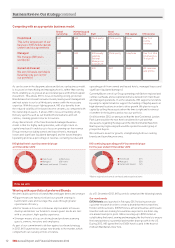
However, the hotel industry demonstrated its resilience against this challenging economic background. Globally, industry revenue per
available room (RevPAR), a key industry indicator, increased by 4.5 per cent, compared to a 5.9 per cent increase in 2011. IHG performed well
against these market conditions, with global RevPAR growth in 2012 of 5.2 per cent.
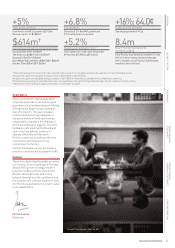
RevPAR growth 2011 v 2012
+5.9%
2011
+6.2%
Global industry
RevPAR growth1
Global IHG
RevPAR growth2
+4.5%
2012
+5.2%
Global industry
RevPAR growth1
Global IHG
RevPAR growth2
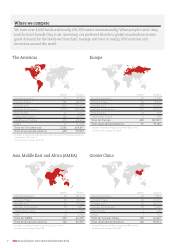
The global hotel market is estimated to be close to 21.5 million rooms. Smith Travel Research calculates that there are 7.3 million branded
hotel rooms, with the remainder a combination of independent hotels, guesthouses and other types of lodging. IHG holds the largest share
of branded rooms, currently approximately nine per cent of branded supply, distributed across nearly 100 countries and territories around
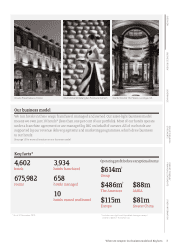
the world. In 2012 we opened 33,922 new rooms worldwide (226 new hotels). This has taken the number of open IHG hotel rooms to 675,982
(4,602 hotels) at 31 December 2012, up 2.7 per cent from 2011, taking into account the removal of hotels which left the IHG System.
The benefits of a brand, such as the greater security and performance of a global reservation system, loyalty programmes and international
networks, are clear to many owners and IHG is well-positioned to win the business of owners seeking to grow with a hotel brand. Additionally,
IHG and other large hotel companies have the competitive advantage of a global portfolio of brands that suit the different real estate or market
opportunities an owner may have.
To ensure our strategy continues to be sustainable in the changing business environment and suitable for the Group’s capabilities, IHG closely
monitors markets across the globe and follows key industry and business metrics such as RevPAR, average daily rate, demand, GDP and
guest satisfaction.
1 Data sourced from Smith Travel Research.
2 Comparable hotels.
Business Review
Industry overview