Holiday Inn 2012 Annual Report Download - page 27
Download and view the complete annual report
Please find page 27 of the 2012 Holiday Inn annual report below. You can navigate through the pages in the report by either clicking on the pages listed below, or by using the keyword search tool below to find specific information within the annual report.-
 1
1 -
2
-
3
-
4
-
5
-
6
-
7
-
8
-
9
-
10
-
11
-
12
-
13
-
14
-
15
-
16
-
 17
17 -
 18
18 -
 19
19 -
 20
20 -
 21
21 -
 22
22 -
 23
23 -
 24
24 -
 25
25 -
 26
26 -
 27
27 -
 28
28 -
 29
29 -
 30
30 -
 31
31 -
 32
32 -
 33
33 -
 34
34 -
 35
35 -
 36
36 -
 37
37 -
38
-
39
-
40
-
41
-
42
-
43
-
44
-
45
-
46
-
47
-
48
-
49
-
50
-
51
-
52
-
53
-
54
-
55
-
56
-
57
-
58
-
59
-
60
-
61
-
62
-
63
-
64
-
65
-
66
-
67
-
68
-
69
-
70
-
71
-
72
-
73
-
74
-
75
-
76
-
77
-
78
-
79
-
80
-
81
-
82
-
83
-
84
-
85
-
86
-
87
-
88
-
89
-
90
-
91
-
92
-
93
-
94
-
95
-
96
-
97
-
98
-
99
-
100
-
101
-
102
-
103
-
104
-
105
-
106
-
107
-
108
-
109
-
110
-
111
-
112
-
113
-
114
-
115
-
116
-
117
-
118
-
119
-
120
-
121
-
122
-
123
-
124
-
125
-
126
-
127
-
128
-
129
-
130
-
131
-
132
-
133
-
134
-
135
-
136
-
137
-
138
-
139
-
140
-
141
-
142
-
143
-
144
 |
 |

Performance 25
OVERVIEW BUSINESS REVIEW GOVERNANCE
GROUP FINANCIAL
STATEMENTS
PARENT COMPANY
FINANCIAL STATEMENTS OTHER INFORMATION
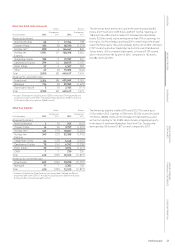
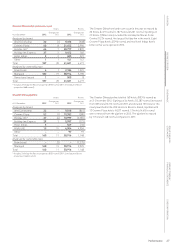
AMEA hotel and room count
Hotels Rooms
At 31 December 2012
Change over
2011 2012
Change over
2011
Analysed by brand
InterContinental 65 120,791 366
Crowne Plaza 65 418,559 1,638
Holiday Inn* 75 (2) 17,440 (592)
Holiday Inn Express 12 42,877 1,020
Staybridge Suites 2–304 –
Other 13 (3) 2,766 (778)
Total 232 462,737 1,654
Analysed by ownership type
Franchised 48 (6) 10,860 (1,757)
Managed 182 10 51,290 3,400
Owned and leased 2–587 11
Total 232 462,737 1,654
* Includes 14 Holiday Inn Resort properties (3,311 rooms) (2011: 13 Holiday Inn Resort
properties (3,121 rooms)).
AMEA pipeline
Hotels Rooms
At 31 December 2012
Change over
2011 2012
Change over
2011
Analysed by brand
InterContinental 20 15,366 272
Crowne Plaza 18 (3) 5,345 (1,384)
Holiday Inn* 47 410,895 515
Holiday Inn Express 35 87,091 1,410
Staybridge Suites 6(1) 728 (120)
Hotel Indigo 61932 80
Total 132 10 30,357 773
Analysed by ownership type
Franchised 2(2) 425 (427)
Managed 130 12 29,932 1,200
Total 132 10 30,357 773
* Includes 4 Holiday Inn Resort properties (900 rooms) (2011: 4 Holiday Inn Resort
properties (900 rooms)).
The AMEA hotel and room count in the year increased by four hotels
(1,654 rooms) to 232 hotels (62,737 rooms). The level of openings
increased from 10 hotels (2,907 rooms) in 2011 to 16 hotels
(4,243 rooms) in 2012. These included four hotels for the
InterContinental brand, including the 197-room InterContinental
Danang Sun Peninsula Resort in Vietnam, as well as the first Holiday
Inn Express hotels in Bahrain, India and Thailand. Six Crowne Plaza
hotels (1,777 rooms) were opened in 2012, including resort locations
in Thailand and Jordan. 12 hotels (2,589 rooms) were removed from
the System in 2012.
The AMEA pipeline totalled 132 hotels (30,357 rooms) as at
31 December 2012. Signings of 36 hotels (7,866 rooms) included
24 hotels (4,657 rooms) in the Holiday Inn brand family. In addition,
six InterContinental hotels (1,728 rooms) were signed, including
resort locations in Thailand and Australia. 10 hotels (2,850 rooms)
were removed from the pipeline in 2012, compared to 32 hotels
(8,243 rooms) in 2011. The pipeline increased by 10 hotels
(773 rooms) compared to 2011.