Holiday Inn 2012 Annual Report Download - page 100
Download and view the complete annual report
Please find page 100 of the 2012 Holiday Inn annual report below. You can navigate through the pages in the report by either clicking on the pages listed below, or by using the keyword search tool below to find specific information within the annual report.-
 1
1 -
2
-
3
-
4
-
5
-
6
-
7
-
8
-
9
-
10
-
11
-
12
-
13
-
14
-
15
-
16
-
17
-
18
-
19
-
20
-
21
-
22
-
23
-
24
-
25
-
26
-
27
-
28
-
29
-
30
-
31
-
32
-
33
-
34
-
35
-
36
-
37
-
38
-
39
-
40
-
41
-
42
-
43
-
44
-
45
-
46
-
47
-
48
-
49
-
50
-
51
-
52
-
53
-
54
-
55
-
56
-
57
-
58
-
59
-
60
-
61
-
62
-
63
-
64
-
65
-
66
-
67
-
68
-
69
-
70
-
71
-
72
-
73
-
74
-
75
-
76
-
77
-
78
-
79
-
80
-
81
-
82
-
83
-
84
-
85
-
86
-
87
-
88
-
89
-
 90
90 -
 91
91 -
 92
92 -
 93
93 -
 94
94 -
 95
95 -
 96
96 -
 97
97 -
 98
98 -
 99
99 -
 100
100 -
 101
101 -
 102
102 -
 103
103 -
 104
104 -
 105
105 -
 106
106 -
 107
107 -
 108
108 -
 109
109 -
 110
110 -
111
-
112
-
113
-
114
-
115
-
116
-
117
-
118
-
119
-
120
-
121
-
122
-
123
-
124
-
125
-
126
-
127
-
128
-
129
-
130
-
131
-
132
-
133
-
134
-
135
-
136
-
137
-
138
-
139
-
140
-
141
-
142
-
143
-
144
 |
 |

98 IHG Annual Report and Financial Statements 2012
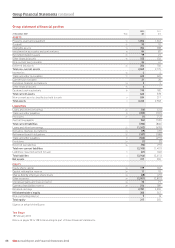
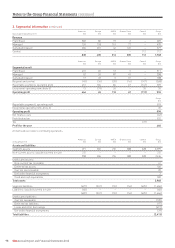
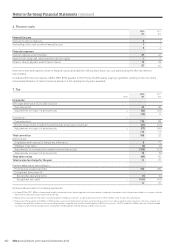
Notes to the Group Financial Statements continued
2. Segmental information continued
Americas Europe AMEA Greater China Central Group
Year ended 31 December 2011 $m $m $m $m $m $m
Revenue
Franchised 502 86 19 2 – 609
Managed 124 118 151 77 – 470
Owned and leased 204 201 46 126 – 577
Central – – – – 112 112
830 405 216 205 112 1,768
Americas Europe AMEA Greater China Central Group
$m $m $m $m $m $m
Segmental result
Franchised 431 65 12 3 – 511
Managed 52 26 87 43 – 208
Owned and leased 17 49 5 37 – 108
Regional and central (49) (36) (20) (16) (147) (268)
Reportable segments’ operating profit 451 104 84 67 (147) 559
Exceptional operating items (note 5) 13 (39) 26 – 35 35
Operating profit 464 65 110 67 (112) 594
Group
$m
Reportable segments’ operating profit 559
Exceptional operating items (note 5) 35
Operating profit 594
Net finance costs (62)
Profit before tax 532
Tax (72)
Profit for the year 460
All items above relate to continuing operations.
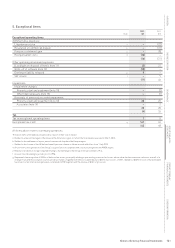
Americas Europe AMEA Greater China Central Group
31 December 2011 $m $m $m $m $m $m
Assets and liabilities
Segment assets 691 816 276 388 228 2,399
Non-current assets classified as held for sale 217 – – – – 217
908 816 276 388 228 2,616
Unallocated assets:
Non-current tax receivable 41
Deferred tax assets 106
Current tax receivable 20
Derivative financial instruments 3
Cash and cash equivalents 182
Total assets 2,968
Segment liabilities (427) (247) (53) (54) (625) (1,406)
Liabilities classified as held for sale (60) – – – – (60)
(487) (247) (53) (54) (625) (1,466)
Unallocated liabilities:
Current tax payable (120)
Deferred tax liabilities (97)
Loans and other borrowings (691)
Derivative financial instruments (39)
Total liabilities (2,413)