Holiday Inn 2012 Annual Report Download - page 123
Download and view the complete annual report
Please find page 123 of the 2012 Holiday Inn annual report below. You can navigate through the pages in the report by either clicking on the pages listed below, or by using the keyword search tool below to find specific information within the annual report.-
 1
1 -
2
-
3
-
4
-
5
-
6
-
7
-
8
-
9
-
10
-
11
-
12
-
13
-
14
-
15
-
16
-
17
-
18
-
19
-
20
-
21
-
22
-
23
-
24
-
25
-
26
-
27
-
28
-
29
-
30
-
31
-
32
-
33
-
34
-
35
-
36
-
37
-
38
-
39
-
40
-
41
-
42
-
43
-
44
-
45
-
46
-
47
-
48
-
49
-
50
-
51
-
52
-
53
-
54
-
55
-
56
-
57
-
58
-
59
-
60
-
61
-
62
-
63
-
64
-
65
-
66
-
67
-
68
-
69
-
70
-
71
-
72
-
73
-
74
-
75
-
76
-
77
-
78
-
79
-
80
-
81
-
82
-
83
-
84
-
85
-
86
-
87
-
88
-
89
-
90
-
91
-
92
-
93
-
94
-
95
-
96
-
97
-
98
-
99
-
100
-
101
-
102
-
103
-
104
-
105
-
106
-
107
-
108
-
109
-
110
-
111
-
112
-
 113
113 -
 114
114 -
 115
115 -
 116
116 -
 117
117 -
 118
118 -
 119
119 -
 120
120 -
 121
121 -
 122
122 -
 123
123 -
 124
124 -
 125
125 -
 126
126 -
 127
127 -
 128
128 -
 129
129 -
 130
130 -
 131
131 -
 132
132 -
 133
133 -
134
-
135
-
136
-
137
-
138
-
139
-
140
-
141
-
142
-
143
-
144
 |
 |

OVERVIEW BUSINESS REVIEW GOVERNANCE
GROUP FINANCIAL
STATEMENTS
PARENT COMPANY
FINANCIAL STATEMENTS OTHER INFORMATION
Notes to the Group Financial Statements 121
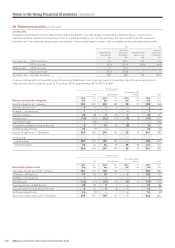
25. Retirement benefits continued
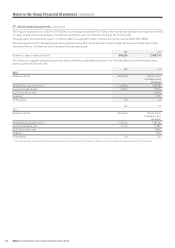
The plan assets are comprised as follows:
2012 2011
Value Value
$m % $m %
UK pension plans
Liability matching investment funds 243 35 290 53
Bonds 232 33 74 13
Equities 62 9 93 17
Hedge funds 31 5 56 10
Cash and other 127 18 38 7
Total market value of assets 695 100 551 100
US pension plans
Equities 60 48 58 53
Fixed income 60 48 52 47
Other 4 4 – –
Total market value of assets 124 100 110 100
The expected overall rates of return on assets, being 4.2% (2011 4.8%) for the UK plan and 6.8% (2011 7.3%) for the US plans, have been
determined following advice from the plans’ independent actuaries and are based on the expected return on each asset class together with
consideration of the plans’ asset strategy. In respect of the UK plan, the long-term rate of return assumptions are 3.5% (2011 3.3%) for
liability matching funds and bonds and 6.4% (2011 7.4%) for equities and other return seeking assets. The UK plan is currently implementing
a de-risking strategy which is resulting in a move out of return seeking assets into liability matching funds and bonds.
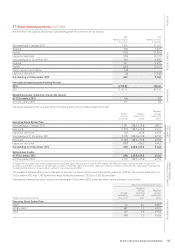
Funding commitments
The most recent actuarial valuation of the InterContinental Hotels UK Pension Plan was carried out as at 31 March 2012 and showed a
deficit of £132m on a funding basis. Under the recovery plan agreed with the trustees, the Group aims to eliminate this deficit by 31 July
2014 principally through additional Company contributions of £130m. In respect of these additional Company contributions, £10m was paid
in July 2012, £45m was paid in October 2012, £30m is due for payment in July 2013, £15m is due for payment in July 2014 and £30m will be
paid into a funding trust on release of a trustee charge over a hotel asset. The amount in the funding trust may be available for release to
the plan on 31 July 2014 to the extent that a funding deficit remains at that time. The plan is formally valued every three years, or earlier
with the agreement of the Company and trustees, and future valuations could lead to changes in the amounts payable by the Company.
Company contributions are expected to be $62m in 2013, including known UK additional contributions of £30m.
2012 2011 2010 2009 2008
History of experience gains and losses $m $m $m $m $m
UK pension plans
Fair value of plan assets 695 551 475 426 437
Present value of benefit obligations (569) (525) (512) (461) (411)
Surplus/(deficit) in the plans 126 26 (37) (35) 26
Experience adjustments arising on plan liabilities (3) (22) (49) (44) 55
Experience adjustments arising on plan assets 6 24 21 (14) (57)
US and other pension plans
Fair value of plan assets 149 133 130 126 112
Present value of benefit obligations (247) (233) (209) (197) (185)
Deficit in the plans (98) (100) (79) (71) (73)
Experience adjustments arising on plan liabilities (16) (26) (13) (13) 3
Experience adjustments arising on plan assets 9 (5) 3 14 (38)
US post-employment benefits
Present value of benefit obligations (25) (30) (27) (20) (19)
Experience adjustments arising on plan liabilities 5 (3) (7) (1) 1
The cumulative amount of net actuarial losses recognised since 1 January 2004 in the Group statement of comprehensive income is $284m
(2011 $285m). The Group is unable to determine how much of the pension scheme deficit recognised on transition to IFRS of $298m and
taken directly to total equity is attributable to actuarial gains and losses since inception of the schemes. Therefore, the Group is unable to
determine the amount of actuarial gains and losses that would have been recognised in the Group statement of comprehensive income
before 1 January 2004.