Holiday Inn 2012 Annual Report Download - page 89
Download and view the complete annual report
Please find page 89 of the 2012 Holiday Inn annual report below. You can navigate through the pages in the report by either clicking on the pages listed below, or by using the keyword search tool below to find specific information within the annual report.-
 1
1 -
2
-
3
-
4
-
5
-
6
-
7
-
8
-
9
-
10
-
11
-
12
-
13
-
14
-
15
-
16
-
17
-
18
-
19
-
20
-
21
-
22
-
23
-
24
-
25
-
26
-
27
-
28
-
29
-
30
-
31
-
32
-
33
-
34
-
35
-
36
-
37
-
38
-
39
-
40
-
41
-
42
-
43
-
44
-
45
-
46
-
47
-
48
-
49
-
50
-
51
-
52
-
53
-
54
-
55
-
56
-
57
-
58
-
59
-
60
-
61
-
62
-
63
-
64
-
65
-
66
-
67
-
68
-
69
-
70
-
71
-
72
-
73
-
74
-
75
-
76
-
77
-
78
-
 79
79 -
 80
80 -
 81
81 -
 82
82 -
 83
83 -
 84
84 -
 85
85 -
 86
86 -
 87
87 -
 88
88 -
 89
89 -
 90
90 -
 91
91 -
 92
92 -
 93
93 -
 94
94 -
 95
95 -
 96
96 -
 97
97 -
 98
98 -
 99
99 -
100
-
101
-
102
-
103
-
104
-
105
-
106
-
107
-
108
-
109
-
110
-
111
-
112
-
113
-
114
-
115
-
116
-
117
-
118
-
119
-
120
-
121
-
122
-
123
-
124
-
125
-
126
-
127
-
128
-
129
-
130
-
131
-
132
-
133
-
134
-
135
-
136
-
137
-
138
-
139
-
140
-
141
-
142
-
143
-
144
 |
 |

OVERVIEW BUSINESS REVIEW GOVERNANCE
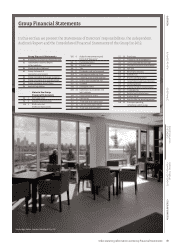
GROUP FINANCIAL
STATEMENTS
PARENT COMPANY
FINANCIAL STATEMENTS OTHER INFORMATION
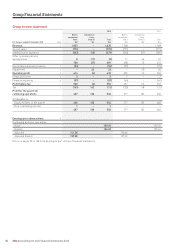
Group statement of changes in equity 87
Group statement of changes in equity continued
Shares Unrealised
Equity Capital held by gains and Currency IHG share- Non-
share redemption employee Other losses translation Retained holders’ controlling Total
capital reserve share trusts reserves reserve reserve earnings equity interest equity
$m $m $m $m $m $m $m $m $m $m
At 1 January 2011 155 10 (35) (2,894) 49 211 2,788 284 7 291
Profit for the year – – – – – – 460 460 – 460
Other comprehensive income:
Gains on valuation of available-
for-sale financial assets – – – – 15 – – 15 – 15
Losses reclassified to income
on impairment of available-for-
sale financial assets – – – – 3 – – 3 – 3
Amounts reclassified to
financial expenses on cash
flow hedges – – – – 4 – – 4 – 4
Actuarial losses on defined
benefit pension plans – – – – – – (19) (19) – (19)
Change in asset restriction
on pension plans in surplus
and liability in respect of
funding commitments – – – – – – (4) (4) – (4)
Exchange differences on
retranslation of foreign
operations – – – – – (22) – (22) 1 (21)
Tax related to pension
contributions – – – – – – 2 2 – 2
Total other comprehensive loss – – – – 22 (22) (21) (21) 1 (20)
Total comprehensive income
for the year – – – – 22 (22) 439 439 1 440
Issue of ordinary shares 8 – – – – – – 8 – 8
Purchase of own shares by
employee share trusts – – (75) – – – – (75) – (75)
Release of own shares by
employee share trusts – – 83 – – – (80) 3 – 3
Equity-settled share-
based cost – – – – – – 29 29 – 29
Tax related to share schemes – – – – – – 7 7 – 7
Equity dividends paid – – – – – – (148) (148) – (148)
Exchange adjustments (1) – – 1 – – – – – –
At 31 December 2011 162 10 (27) (2,893) 71 189 3,035 547 8 555
All items above are shown net of tax.
Notes on pages 90 to 128 form an integral part of these Financial Statements.