Holiday Inn 2012 Annual Report Download - page 31
Download and view the complete annual report
Please find page 31 of the 2012 Holiday Inn annual report below. You can navigate through the pages in the report by either clicking on the pages listed below, or by using the keyword search tool below to find specific information within the annual report.-
 1
1 -
2
-
3
-
4
-
5
-
6
-
7
-
8
-
9
-
10
-
11
-
12
-
13
-
14
-
15
-
16
-
17
-
18
-
19
-
20
-
 21
21 -
 22
22 -
 23
23 -
 24
24 -
 25
25 -
 26
26 -
 27
27 -
 28
28 -
 29
29 -
 30
30 -
 31
31 -
 32
32 -
 33
33 -
 34
34 -
 35
35 -
 36
36 -
 37
37 -
 38
38 -
 39
39 -
 40
40 -
 41
41 -
42
-
43
-
44
-
45
-
46
-
47
-
48
-
49
-
50
-
51
-
52
-
53
-
54
-
55
-
56
-
57
-
58
-
59
-
60
-
61
-
62
-
63
-
64
-
65
-
66
-
67
-
68
-
69
-
70
-
71
-
72
-
73
-
74
-
75
-
76
-
77
-
78
-
79
-
80
-
81
-
82
-
83
-
84
-
85
-
86
-
87
-
88
-
89
-
90
-
91
-
92
-
93
-
94
-
95
-
96
-
97
-
98
-
99
-
100
-
101
-
102
-
103
-
104
-
105
-
106
-
107
-
108
-
109
-
110
-
111
-
112
-
113
-
114
-
115
-
116
-
117
-
118
-
119
-
120
-
121
-
122
-
123
-
124
-
125
-
126
-
127
-
128
-
129
-
130
-
131
-
132
-
133
-
134
-
135
-
136
-
137
-
138
-
139
-
140
-
141
-
142
-
143
-
144
 |
 |

Performance 29
OVERVIEW BUSINESS REVIEW GOVERNANCE
GROUP FINANCIAL
STATEMENTS
PARENT COMPANY
FINANCIAL STATEMENTS OTHER INFORMATION
Other financial information
Exceptional operating items
Exceptional operating items totalled a net loss of $4m. Exceptional
gains included a $23m impairment reversal and the release of a $9m
liability no longer required relating to the 2003 demerger of the Group
from Six Continents PLC. Exceptional charges included $16m from
the reorganisation of the Group’s support functions together with a
restructuring in the AMEA region, $2m loss on disposal of an interest
in a hotel and $18m write-off of software.
Exceptional operating items are treated as exceptional by reason of
their size or nature and are excluded from the calculation of adjusted
earnings per ordinary share in order to provide a more meaningful
comparison of performance.
Net financial expenses
Net financial expenses decreased by $8m to $54m primarily due to
lower average debt levels.
Financing costs included $2m (2011 $1m) of interest costs associated
with Priority Club Rewards where interest is charged on the
accumulated balance of cash received in advance of the redemption
points awarded. Financing costs in 2012 also included $19m (2011
$18m) in respect of the InterContinental Boston finance lease.
Taxation
The effective rate of tax on operating profit excluding the impact of
exceptional items, was 27% (2011 24%). Excluding the impact of prior
year items, the equivalent tax rate would be 30% (2011 36%). This rate
is higher than the average UK statutory rate of 24.5% due mainly to
certain overseas profits (particularly in the US) being subject to
statutory rates higher than the UK statutory rate, unrelieved foreign
taxes and disallowable expenses.
Taxation within exceptional items totalled a credit of $142m
(2011 $48m). This represented, primarily, the recognition of $104m
of deferred tax assets whose value has become more certain as
a result of a change in law and the resolution of prior period tax
matters, together with the associated release of $37m of provisions.
In 2011 the credit mainly related to a revision of the estimated tax
impacts of an internal reorganisation completed in 2010.
Net tax paid in 2012 totalled $122m (2011 $90m) including $3m paid
(2011 $1m) in respect of disposals. Tax paid represents an effective
rate of 22% (2011 17%) on total profits and is lower than the effective
income statement tax rate of 27% primarily due to the impact of
deferred taxes (including the realisation of assets such as tax losses),
the receipt of refunds in respect of prior years and provisions for
tax for which no payment of tax has currently been made.
IHG pursues a tax strategy that is consistent with its business
strategy and its overall business conduct principles. This strategy
seeks to ensure full compliance with all tax filing, payment and
reporting obligations on the basis of communicative and transparent
relationships with tax authorities. Policies and procedures related
to tax risk management are subject to regular review and update,
and are approved by the Board.
Tax liabilities or refunds may differ from those anticipated,
in particular as a result of changes in tax law, changes in the
interpretation of tax law, or clarification of uncertainties in the
application of tax law. Procedures to minimise risk include the
preparation of thorough tax risk assessments for all transactions
carrying tax risk and, where appropriate, material tax uncertainties
are discussed and resolved with tax authorities in advance.
IHG’s contribution to the jurisdictions in which it operates includes
a significant contribution in the form of taxes borne and collected,
including taxes on its revenues and profits and in respect of the
employment its business generates.
IHG earns approximately 60% of its revenues in the form of franchise,
management or similar fees, with almost 90% of IHG branded hotels
being franchised. In jurisdictions in which IHG does franchise business,
the prevailing tax law will generally provide for IHG to be taxed in the
form of local withholding taxes based on a percentage of fees rather
than based on profits. Costs to support the franchise business are
normally incurred regionally or globally and therefore profits for an
individual franchise jurisdiction cannot be separately determined.
Earnings per ordinary share
Basic earnings per ordinary share in 2012 was 189.5¢, compared
with 159.2¢ in 2011. Adjusted earnings per ordinary share was 141.5¢,
against 130.4¢ in 2011.
Dividends
The Board has proposed a final dividend per ordinary share of
43.0¢ (27.7p). With the interim dividend per ordinary share of 21.0¢
(13.5p), the full-year dividend per ordinary share for 2012 will total
64.0¢ (41.2p), an increase of 16% over 2011. On 22 October 2012 a
special dividend of $1.72 (108.4p) per ordinary share was paid to
shareholders.
Share price and market capitalisation
The IHG share price closed at £17.07 on 31 December 2012, up from
£11.57 on 31 December 2011. The market capitalisation of the Group
at the year end was £4.6bn.
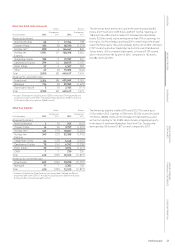
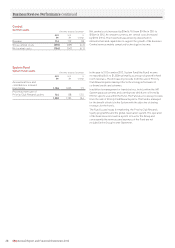
Capital structure and liquidity management
Net debt* at 31 December 2012
$m
2011
$m
Borrowings:
Sterling 638 –
US dollar 626 715
Other 55
Cash and cash equivalents (195) (182)
Net debt 1,074 538
Average debt levels 651 721
* Including the impact of currency derivatives.
Facilities at 31 December 2012
$m
2011
$m
Committed 1,075 1,075
Uncommitted 96 79
Total 1,171 1,154
Interest risk profile of gross debt for
major currencies at 31 December 2012
%
2011
%
At fixed rates 100 100
During the year, $472m of cash was generated from operating
activities of which $133m was invested in capital expenditure.
After shareholder returns of $786m, including a $505m special
dividend and $107m of share buybacks, net debt at 31 December
2012 was $1,074m, an increase over the year of $536m. Net debt
included $212m in respect of the finance lease obligations for the
InterContinental Boston and $11m in respect of currency swaps
related to the £250m sterling bond.
In November 2012, the Group issued a 10-year £400m public bond
under its Medium Term Notes programme. The bond has a coupon
of 3.875% and extends the maturity profile and diversifies the
sources of the Group’s debt. The Group issued its first bond under
the programme in December 2009 which was a £250m seven-year
public bond at a coupon of 6%, which was immediately swapped into
US dollar debt using currency swaps.
The Group refinanced its bank debt in November 2011, putting in
place a five-year $1.07bn syndicated bank facility which matures
in November 2016. This facility was undrawn at the year end.
Additional funding is provided by a finance lease on the
InterContinental Boston.