Holiday Inn 2012 Annual Report Download - page 20
Download and view the complete annual report
Please find page 20 of the 2012 Holiday Inn annual report below. You can navigate through the pages in the report by either clicking on the pages listed below, or by using the keyword search tool below to find specific information within the annual report.-
 1
1 -
2
-
3
-
4
-
5
-
6
-
7
-
8
-
9
-
 10
10 -
 11
11 -
 12
12 -
 13
13 -
 14
14 -
 15
15 -
 16
16 -
 17
17 -
 18
18 -
 19
19 -
 20
20 -
 21
21 -
 22
22 -
 23
23 -
 24
24 -
 25
25 -
 26
26 -
 27
27 -
 28
28 -
 29
29 -
 30
30 -
31
-
32
-
33
-
34
-
35
-
36
-
37
-
38
-
39
-
40
-
41
-
42
-
43
-
44
-
45
-
46
-
47
-
48
-
49
-
50
-
51
-
52
-
53
-
54
-
55
-
56
-
57
-
58
-
59
-
60
-
61
-
62
-
63
-
64
-
65
-
66
-
67
-
68
-
69
-
70
-
71
-
72
-
73
-
74
-
75
-
76
-
77
-
78
-
79
-
80
-
81
-
82
-
83
-
84
-
85
-
86
-
87
-
88
-
89
-
90
-
91
-
92
-
93
-
94
-
95
-
96
-
97
-
98
-
99
-
100
-
101
-
102
-
103
-
104
-
105
-
106
-
107
-
108
-
109
-
110
-
111
-
112
-
113
-
114
-
115
-
116
-
117
-
118
-
119
-
120
-
121
-
122
-
123
-
124
-
125
-
126
-
127
-
128
-
129
-
130
-
131
-
132
-
133
-
134
-
135
-
136
-
137
-
138
-
139
-
140
-
141
-
142
-
143
-
144
 |
 |

18 IHG Annual Report and Financial Statements 2012
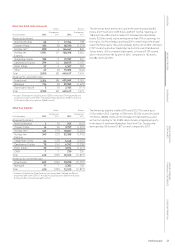
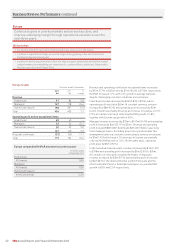
12 months ended 31 December
2012
$m
2011
$m
%
change
Revenue
Americas 837 830 0.8
Europe 436 405 7.7
AMEA 218 216 0.9
Greater China 230 205 12.2
Central 114 112 1.8
1,835 1,768 3.8
Operating profit
Americas 486 451 7.8
Europe 115 104 10.6
AMEA 88 84 4.8
Greater China 81 67 20.9
Central (156) (147) (6.1)
Operating profit before
exceptional items
614
559
9.8
Exceptional operating items (4) 35 (111.4)
610 594 2.7
Net financial expenses (54) (62) 12.9
Profit before tax 556 532 4.5
Earnings per ordinary share
Basic 189.5¢ 159.2¢ 19.0
Adjusted 141.5¢ 130.4¢ 8.5
Average US dollar to sterling
exchange rate
$1:£0.63
$1:£0.62
1.6
Revenue increased by 3.8% to $1,835m and operating profit before
exceptional items increased by 9.8% to $614m during the 12 months
ended 31 December 2012.
Fee revenue, being Group revenue excluding revenue from owned
and leased hotels, significant liquidated damages received
in 2012 and 2011 and properties that are structured for legal
reasons as operating leases, but with the same characteristics
as management contracts, increased by 6.8% when translated
at constant currency and applying 2011 exchange rates.
The 2012 results reflect continued RevPAR growth in each of the
regions, with an overall RevPAR increase of 5.2%, including a 3.2%
increase in average daily rate. The results also benefited from
System size growth of 2.7% year-on-year to 675,982 rooms. Group
RevPAR growth remained robust for the year, reflecting favourable
supply and demand dynamics in the US over 2012, although trading
was also affected by the impact of Eurozone uncertainty as well as
industry-wide challenges in Greater China in the latter part of the
year related to the political leadership change.
Operating profit improved in each of the regions. RevPAR growth
of 6.1% in The Americas helped drive an operating profit increase of
$42m (9.5%), after excluding the benefit of a $3m liquidated damages
receipt in 2012 and a $10m liquidated damages receipt in 2011.
Operating profit in Europe increased by $11m (10.6%), with RevPAR
growth of 1.7%. Operating profit in AMEA increased by $13m (17.3%)
after adjusting for a $6m liquidated damages receipt in 2011 and the
disposal of a hotel asset and partnership interest that contributed
$3m in profits in 2011, reflecting RevPAR growth of 4.9%. Strong
operating profit growth of $14m in Greater China reflected an 11.6%
increase in System size as well as 5.4% RevPAR growth.
At constant currency, central overheads increased from $147m to
$158m in 2012 ($156m at actual currency), reflecting investment in
infrastructure and capabilities to support the growth of the business.
Operating profit margin was 42.6%, up 2.0 percentage points on 2011,
after adjusting for owned and leased hotels. The Americas and
Europe managed leases and significant liquidated damages received
in 2012 and 2011.
Profit before tax increased by $24m to $556m. Adjusted earnings per
ordinary share increased by 8.5% to 141.5¢.
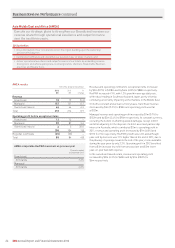
Group results
Total gross revenue
2012
$bn
2011
$bn
%
change
InterContinental 4.5 4.4 2.3
Crowne Plaza 4.0 3.9 2.6
Holiday Inn 6.3 6.0 5.0
Holiday Inn Express 4.8 4.4 9.1
Staybridge Suites 0.6 0.6 –
Candlewood Suites 0.5 0.5 –
Hotel Indigo 0.2 0.1 100.0
Other 0.3 0.3 –
Total 21.2 20.2 5.0
One measure of IHG System performance is the growth in total gross
revenue, defined as total room revenue from franchised hotels and
total hotel revenue from managed, owned and leased hotels. Total
gross revenue is not revenue attributable to IHG, as it is derived
mainly from hotels owned by third parties.
Total gross revenue increased by 5.0% from $20.2bn in 2011 to
$21.2bn in 2012, including a 5.0% increase in Holiday Inn and a 9.1%
increase in Holiday Inn Express.
Group performance
Business Review
Performance