Holiday Inn 2012 Annual Report Download - page 126
Download and view the complete annual report
Please find page 126 of the 2012 Holiday Inn annual report below. You can navigate through the pages in the report by either clicking on the pages listed below, or by using the keyword search tool below to find specific information within the annual report.-
 1
1 -
2
-
3
-
4
-
5
-
6
-
7
-
8
-
9
-
10
-
11
-
12
-
13
-
14
-
15
-
16
-
17
-
18
-
19
-
20
-
21
-
22
-
23
-
24
-
25
-
26
-
27
-
28
-
29
-
30
-
31
-
32
-
33
-
34
-
35
-
36
-
37
-
38
-
39
-
40
-
41
-
42
-
43
-
44
-
45
-
46
-
47
-
48
-
49
-
50
-
51
-
52
-
53
-
54
-
55
-
56
-
57
-
58
-
59
-
60
-
61
-
62
-
63
-
64
-
65
-
66
-
67
-
68
-
69
-
70
-
71
-
72
-
73
-
74
-
75
-
76
-
77
-
78
-
79
-
80
-
81
-
82
-
83
-
84
-
85
-
86
-
87
-
88
-
89
-
90
-
91
-
92
-
93
-
94
-
95
-
96
-
97
-
98
-
99
-
100
-
101
-
102
-
103
-
104
-
105
-
106
-
107
-
108
-
109
-
110
-
111
-
112
-
113
-
114
-
115
-
 116
116 -
 117
117 -
 118
118 -
 119
119 -
 120
120 -
 121
121 -
 122
122 -
 123
123 -
 124
124 -
 125
125 -
 126
126 -
 127
127 -
 128
128 -
 129
129 -
 130
130 -
 131
131 -
 132
132 -
 133
133 -
 134
134 -
 135
135 -
 136
136 -
137
-
138
-
139
-
140
-
141
-
142
-
143
-
144
 |
 |

124 IHG Annual Report and Financial Statements 2012
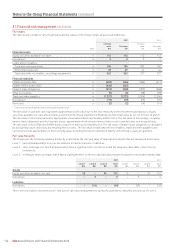
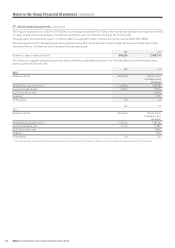
27. Share-based payments continued
The Group recognised a cost of $22m (2011 $25m) in operating profit and $1m (2011 $nil) within exceptional administrative expenses related
to equity-settled share-based payment transactions during the year, net of amounts borne by the System Fund.
The aggregate consideration in respect of ordinary shares issued under option schemes during the year was $10m (2011 $8m).
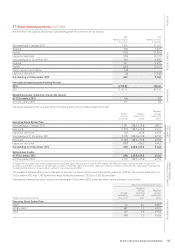
The following table sets forth awards and options granted during 2012. No awards were granted under the Executive Share Option Plan,
Sharesave Plan or US Employee Stock Purchase Plan during the year.
ABP LTIP
Number of shares awarded in 2012 340,924 2,698,714
The Group uses separate option pricing models and assumptions depending on the plan. The following tables set out information about
awards granted in 2012 and 2011:
ABP LTIP
2012
Valuation model Binomial Monte Carlo
Simulation and
Binomial
Weighted average share price 1,440.0p 1,440.0p
Expected dividend yield 2.95% 2.99%
Risk-free interest rate 0.59%
Volatility* 31%
Term (years) 3.0 3.0
ABP LTIP
2011
Valuation model Binomial Monte Carlo
Simulation and
Binomial
Weighted average share price 1,415.0p 1,281.0p
Expected dividend yield 2.14% 2.78%
Risk-free interest rate 1.88%
Volatility* 39%
Term (years) 3.0 3.0
* The expected volatility was determined by calculating the historical volatility of the Company’s share price corresponding to the expected life of the share award.
Notes to the Group Financial Statements continued