Holiday Inn 2012 Annual Report Download - page 110
Download and view the complete annual report
Please find page 110 of the 2012 Holiday Inn annual report below. You can navigate through the pages in the report by either clicking on the pages listed below, or by using the keyword search tool below to find specific information within the annual report.-
 1
1 -
2
-
3
-
4
-
5
-
6
-
7
-
8
-
9
-
10
-
11
-
12
-
13
-
14
-
15
-
16
-
17
-
18
-
19
-
20
-
21
-
22
-
23
-
24
-
25
-
26
-
27
-
28
-
29
-
30
-
31
-
32
-
33
-
34
-
35
-
36
-
37
-
38
-
39
-
40
-
41
-
42
-
43
-
44
-
45
-
46
-
47
-
48
-
49
-
50
-
51
-
52
-
53
-
54
-
55
-
56
-
57
-
58
-
59
-
60
-
61
-
62
-
63
-
64
-
65
-
66
-
67
-
68
-
69
-
70
-
71
-
72
-
73
-
74
-
75
-
76
-
77
-
78
-
79
-
80
-
81
-
82
-
83
-
84
-
85
-
86
-
87
-
88
-
89
-
90
-
91
-
92
-
93
-
94
-
95
-
96
-
97
-
98
-
99
-
 100
100 -
 101
101 -
 102
102 -
 103
103 -
 104
104 -
 105
105 -
 106
106 -
 107
107 -
 108
108 -
 109
109 -
 110
110 -
 111
111 -
 112
112 -
 113
113 -
 114
114 -
 115
115 -
 116
116 -
 117
117 -
 118
118 -
 119
119 -
 120
120 -
121
-
122
-
123
-
124
-
125
-
126
-
127
-
128
-
129
-
130
-
131
-
132
-
133
-
134
-
135
-
136
-
137
-
138
-
139
-
140
-
141
-
142
-
143
-
144
 |
 |

108 IHG Annual Report and Financial Statements 2012
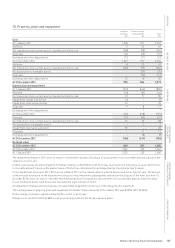
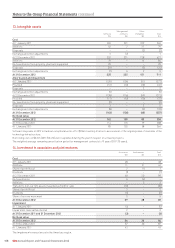
13. Intangible assets
Management Other
Software contracts intangibles Total
$m $m $m $m
Cost
At 1 January 2011 203 231 109 543
Additions 46 2 31 79
Disposals – – (2) (2)
Exchange and other adjustments 3 (2) – 1
At 31 December 2011 252 231 138 621
Additions 70 – 14 84
Reclassification from property, plant and equipment 25 – – 25
Disposals (21) – (3) (24)
Exchange and other adjustments (1) 4 2 5
At 31 December 2012 325 235 151 711
Amortisation and impairment
At 1 January 2011 (120) (106) (51) (277)
Provided (13) (10) (10) (33)
Disposals – – 2 2
Exchange and other adjustments (5) – – (5)
At 31 December 2011 (138) (116) (59) (313)
Provided (17) (10) (10) (37)
Reclassification from property, plant and equipment (2) – – (2)
Disposals 2 – 3 5
Exchange and other adjustments (8) – (2) (10)
At 31 December 2012 (163) (126) (68) (357)
Net book value
At 31 December 2012 162 109 83 354
At 31 December 2011 114 115 79 308
At 1 January 2011 83 125 58 266
Software disposals in 2012 include an exceptional write-off of $18m resulting from a re-assessment of the ongoing value of elements of the
technology infrastructure.
Borrowing costs of $0.3m (2011 $0.4m) were capitalised during the year in respect of software projects.
The weighted average remaining amortisation period for management contracts is 19 years (2011 20 years).
14. Investment in associates and joint ventures
Associates Joint ventures Total
$m $m $m
Cost
At 1 January 2011 48 – 48
Additions 11 31 42
Share of profit/(loss) 2 (1) 1
Dividends (1) – (1)
At 31 December 2011 60 30 90
Reclassification 4 (4) –
Additions – 2 2
Transfer to non-current assets classified as held for sale (10) – (10)
Share of profit/(loss) 3 – 3
Dividends (3) – (3)
Share of reserve movement 5 – 5
At 31 December 2012 59 28 87
Impairment
At 1 January 2011 (5) – (5)
Impairment reversal (see below) 2 – 2
At 31 December 2011 and 31 December 2012 (3) – (3)
Net book value
At 31 December 2012 56 28 84
At 31 December 2011 57 30 87
At 1 January 2011 43 – 43
The impairment reversal arose in the Americas region.
Notes to the Group Financial Statements continued