Holiday Inn 2012 Annual Report Download - page 139
Download and view the complete annual report
Please find page 139 of the 2012 Holiday Inn annual report below. You can navigate through the pages in the report by either clicking on the pages listed below, or by using the keyword search tool below to find specific information within the annual report.-
 1
1 -
2
-
3
-
4
-
5
-
6
-
7
-
8
-
9
-
10
-
11
-
12
-
13
-
14
-
15
-
16
-
17
-
18
-
19
-
20
-
21
-
22
-
23
-
24
-
25
-
26
-
27
-
28
-
29
-
30
-
31
-
32
-
33
-
34
-
35
-
36
-
37
-
38
-
39
-
40
-
41
-
42
-
43
-
44
-
45
-
46
-
47
-
48
-
49
-
50
-
51
-
52
-
53
-
54
-
55
-
56
-
57
-
58
-
59
-
60
-
61
-
62
-
63
-
64
-
65
-
66
-
67
-
68
-
69
-
70
-
71
-
72
-
73
-
74
-
75
-
76
-
77
-
78
-
79
-
80
-
81
-
82
-
83
-
84
-
85
-
86
-
87
-
88
-
89
-
90
-
91
-
92
-
93
-
94
-
95
-
96
-
97
-
98
-
99
-
100
-
101
-
102
-
103
-
104
-
105
-
106
-
107
-
108
-
109
-
110
-
111
-
112
-
113
-
114
-
115
-
116
-
117
-
118
-
119
-
120
-
121
-
122
-
123
-
124
-
125
-
126
-
127
-
128
-
 129
129 -
 130
130 -
 131
131 -
 132
132 -
 133
133 -
 134
134 -
 135
135 -
 136
136 -
 137
137 -
 138
138 -
 139
139 -
 140
140 -
 141
141 -
 142
142 -
 143
143 -
 144
144
 |
 |

Other information
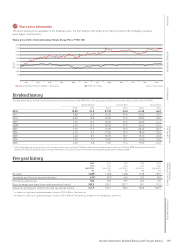
Shareholder profiles
OVERVIEW BUSINESS REVIEW GOVERNANCE
PARENT COMPANY
FINANCIAL STATEMENTS OTHER INFORMATION
GROUP FINANCIAL
STATEMENTS
Glossary and Shareholder profiles 137
Percentage
Percentage Number of of issued
Number of total of ordinary share capital
Category of shareholdings shareholders shareholders shares See chart
■
Private individuals 47,077 94.46 17,059,256 6.36
■
Nominee companies 2,383 4.78 242,910,573 90.53
■
Limited and public limited
companies 221 0.44 1,421,014 0.53
■
Other corporate bodies 145 0.30 6,731,137 2.51
■
Pension funds, insurance
companies and banks 12 0.02 203,091 0.07
Total 49,838 100 268,325,071 100
Percentage
of issued
share capital1
Country/Jurisdiction See chart
■
UK 51.0
■
Rest of Europe 11.8
■
USA (including ADRs) 32.6
■
Rest of World 4.6
Total 100
Percentage
Percentage Number of of issued
Number of total of ordinary share capital
Range of shareholdings shareholders shareholders shares See chart
■
1 – 199 31,692 63.59 2,032,132 0.76
■
200 – 499 9,528 19.12 3,050,566 1.14
■
500 – 999 4,508 9.05 3,153,476 1.17
■
1,000 – 4,999 3,168 6.36 5,896,590 2.20
■
5,000 – 9,999 260 0.52 1,830,791 0.68
■
10,000 – 49,999 355 0.71 8,068,630 3.00
■
50,000 – 99,999 97 0.19 7,311,296 2.72
■
100,000 – 499,999 145 0.29 32,377,070 12.07
■
500,000 – 999,999 33 0.07 24,839,873 9.26
■
1,000,000 and above 52 0.10 179,764,647 67.00
Total 49,838 100 268,325,071 100
Shareholder profile by type as at 31 December 2012
Shareholder profile by geographical location as at 31 December 2012
Shareholder profile by size as at 31 December 2012
1 The geographical profile presented is based on an analysis of shareholders (by manager) of 40,000 shares or above where geographical ownership is known.
This analysis only captures 89.3% of total issued share capital. Therefore, the known percentage distributions have been multiplied by 100⁄89.3 (1.120) to achieve
the figures shown in the table above.