Holiday Inn 2012 Annual Report Download - page 113
Download and view the complete annual report
Please find page 113 of the 2012 Holiday Inn annual report below. You can navigate through the pages in the report by either clicking on the pages listed below, or by using the keyword search tool below to find specific information within the annual report.-
 1
1 -
2
-
3
-
4
-
5
-
6
-
7
-
8
-
9
-
10
-
11
-
12
-
13
-
14
-
15
-
16
-
17
-
18
-
19
-
20
-
21
-
22
-
23
-
24
-
25
-
26
-
27
-
28
-
29
-
30
-
31
-
32
-
33
-
34
-
35
-
36
-
37
-
38
-
39
-
40
-
41
-
42
-
43
-
44
-
45
-
46
-
47
-
48
-
49
-
50
-
51
-
52
-
53
-
54
-
55
-
56
-
57
-
58
-
59
-
60
-
61
-
62
-
63
-
64
-
65
-
66
-
67
-
68
-
69
-
70
-
71
-
72
-
73
-
74
-
75
-
76
-
77
-
78
-
79
-
80
-
81
-
82
-
83
-
84
-
85
-
86
-
87
-
88
-
89
-
90
-
91
-
92
-
93
-
94
-
95
-
96
-
97
-
98
-
99
-
100
-
101
-
102
-
 103
103 -
 104
104 -
 105
105 -
 106
106 -
 107
107 -
 108
108 -
 109
109 -
 110
110 -
 111
111 -
 112
112 -
 113
113 -
 114
114 -
 115
115 -
 116
116 -
 117
117 -
 118
118 -
 119
119 -
 120
120 -
 121
121 -
 122
122 -
 123
123 -
124
-
125
-
126
-
127
-
128
-
129
-
130
-
131
-
132
-
133
-
134
-
135
-
136
-
137
-
138
-
139
-
140
-
141
-
142
-
143
-
144
 |
 |

OVERVIEW BUSINESS REVIEW GOVERNANCE
GROUP FINANCIAL
STATEMENTS
PARENT COMPANY
FINANCIAL STATEMENTS OTHER INFORMATION
Notes to the Group Financial Statements 111
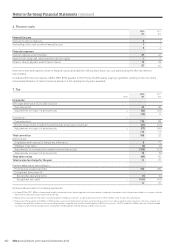
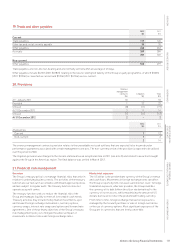
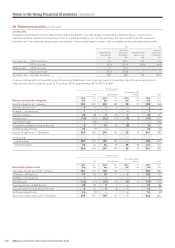
19. Trade and other payables
2012 2011
$m $m
Current
Trade payables 117 126
Other tax and social security payable 35 35
Other payables 268 262
Accruals 289 284
709 707
Non-current
Other payables 563 497
Trade payables are non-interest-bearing and are normally settled within an average of 45 days.
Other payables include $623m (2011 $578m) relating to the future redemption liability of the Group’s loyalty programme, of which $108m
(2011 $105m) is classified as current and $515m (2011 $473m) as non-current.
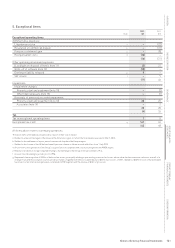
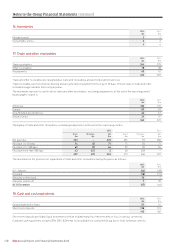
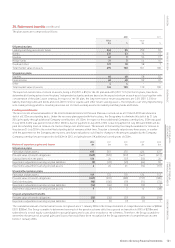
20. Provisions
Onerous
management
contracts Litigation Total
$m $m $m
At 1 January 2011 10 – 10
Provided 1 22 23
Utilised (8) (11) (19)
At 31 December 2011 3 11 14
Utilised (1) (11) (12)
At 31 December 2012 2 – 2
2012 2011
$m $m
Analysed as:
Current 1 12
Non-current 1 2
2 14
The onerous management contracts provision relates to the unavoidable net cash outflows that are expected to be incurred under
performance guarantees associated with certain management contracts. The non-current portion of the provision is expected to be utilised
over the period to 2020.
The litigation provision was charged in the income statement as an exceptional item in 2011 (see note 5) and related to an action brought
against the Group in the Americas region. The final balance was settled in March 2012.
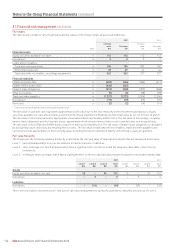
21. Financial risk management
Overview
The Group’s treasury policy is to manage financial risks that arise in
relation to underlying business needs. The activities of the treasury
function are carried out in accordance with Board approved policies
and are subject to regular audit. The treasury function does not
operate as a profit centre.
The treasury function seeks to reduce the financial risk of the
Group and manages liquidity to meet all foreseeable cash needs.
Treasury activities may include money market investments, spot
and forward foreign exchange instruments, currency options,
currency swaps, interest rate swaps and options and forward rate
agreements. One of the primary objectives of the Group’s treasury
risk management policy is to mitigate the adverse impact of
movements in interest rates and foreign exchange rates.
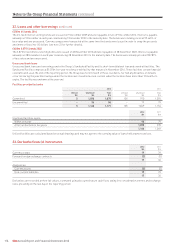
Market risk exposure
The US dollar is the predominant currency of the Group’s revenue
and cash flows. Movements in foreign exchange rates can affect
the Group’s reported profit, net assets and interest cover. To hedge
translation exposure, wherever possible, the Group matches
the currency of its debt (either directly or via derivatives) to the
currency of its net assets, whilst maximising the amount of US
dollars borrowed to reflect the predominant trading currency.
From time to time, foreign exchange transaction exposure is
managed by the forward purchase or sale of foreign currencies
or the use of currency options. Most significant exposures of the
Group are in currencies that are freely convertible.