Holiday Inn 2012 Annual Report Download - page 22
Download and view the complete annual report
Please find page 22 of the 2012 Holiday Inn annual report below. You can navigate through the pages in the report by either clicking on the pages listed below, or by using the keyword search tool below to find specific information within the annual report.-
 1
1 -
2
-
3
-
4
-
5
-
6
-
7
-
8
-
9
-
10
-
11
-
 12
12 -
 13
13 -
 14
14 -
 15
15 -
 16
16 -
 17
17 -
 18
18 -
 19
19 -
 20
20 -
 21
21 -
 22
22 -
 23
23 -
 24
24 -
 25
25 -
 26
26 -
 27
27 -
 28
28 -
 29
29 -
 30
30 -
 31
31 -
 32
32 -
33
-
34
-
35
-
36
-
37
-
38
-
39
-
40
-
41
-
42
-
43
-
44
-
45
-
46
-
47
-
48
-
49
-
50
-
51
-
52
-
53
-
54
-
55
-
56
-
57
-
58
-
59
-
60
-
61
-
62
-
63
-
64
-
65
-
66
-
67
-
68
-
69
-
70
-
71
-
72
-
73
-
74
-
75
-
76
-
77
-
78
-
79
-
80
-
81
-
82
-
83
-
84
-
85
-
86
-
87
-
88
-
89
-
90
-
91
-
92
-
93
-
94
-
95
-
96
-
97
-
98
-
99
-
100
-
101
-
102
-
103
-
104
-
105
-
106
-
107
-
108
-
109
-
110
-
111
-
112
-
113
-
114
-
115
-
116
-
117
-
118
-
119
-
120
-
121
-
122
-
123
-
124
-
125
-
126
-
127
-
128
-
129
-
130
-
131
-
132
-
133
-
134
-
135
-
136
-
137
-
138
-
139
-
140
-
141
-
142
-
143
-
144
 |
 |

20 IHG Annual Report and Financial Statements 2012
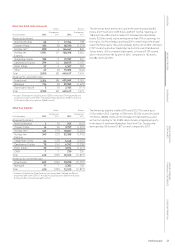
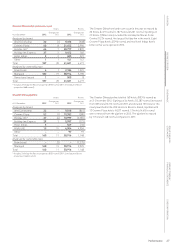
Americas results
12 months ended 31 December
2012
$m
2011
$m
%
change
Revenue
Franchised 541 502 7.8
Managed 97 124 (21.8)
Owned and leased 199 204 (2.5)
Total 837 830 0.8
Operating profit before exceptional items
Franchised 466 431 8.1
Managed 48 52 (7.7)
Owned and leased 24 17 41.2
538 500 7.6
Regional overheads (52) (49) (6.1)
Total 486 451 7.8
Americas comparable RevPAR movement on previous year
12 months ended
31 December 2012
Franchised
Crowne Plaza 5.4%
Holiday Inn 5.9%
Holiday Inn Express 6.1%
All brands 6.0%
Managed
InterContinental 10.5%
Crowne Plaza 3.8%
Holiday Inn 9.6%
Staybridge Suites (1.7)%
Candlewood Suites (0.8)%
All brands 7.3%
Owned and leased
All brands 6.3%
Revenue and operating profit before exceptional items increased
by $7m (0.8%) to $837m and by $35m (7.8%) to $486m respectively.
RevPAR increased 6.1%, with 4.1% growth in average daily rate.
US RevPAR was up 6.3% in 2012 despite uncertainty regarding the
presidential election and the ‘fiscal cliff’ in the latter part of the year.
Franchised revenue increased by $39m (7.8%) to $541m. Royalties
growth of 8.7% was driven by RevPAR growth of 6.0%, including 6.1%
for Holiday Inn Express, together with System size growth of 2.3%.
Operating profit increased by $35m (8.1%) to $466m.
Managed revenue decreased by $27m (21.8%) to $97m and operating
profit decreased by $4m (7.7%) to $48m. Revenue and operating
profit included $34m (2011 $59m) and $nil (2011 $1m) respectively
from managed leases. Excluding properties operated under this
arrangement, as well as the benefit of a $3m liquidated damages
receipt in 2012 and a $10m liquidated damages receipt in 2011,
revenue and operating profit grew by $5m (9.1%) and $4m (9.8%)
respectively. Growth was driven by a RevPAR increase of 7.3%,
including 9.6% for Holiday Inn.
Owned and leased revenue declined by $5m (2.5%) to $199m and
operating profit grew by $7m (41.2%) to $24m. Excluding the impact
of disposals, revenue increased by $4m (2.1%) and operating profit
increased by $8m (50.0%). The increase in revenue was driven by
RevPAR growth of 6.3%, offset by the impact of the partial closure
of an owned hotel in the Caribbean. The operating profit increase
of $7m included a $1m year-on-year benefit from lower depreciation
recorded for the InterContinental New York Barclay since the hotel
was categorised as held for sale in the first quarter of 2011, after
which no depreciation was charged, and a $3m year-on-year benefit
relating to one-off reorganisation costs at one hotel in 2011.
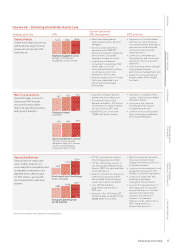
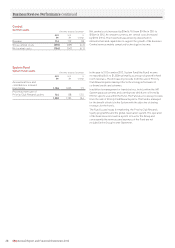
The Americas
Maximise the performance and growth of our portfolio of preferred
Brands, focussing on our core midscale and upscale segments, mostly
through franchise agreements over the next three years.
2013 priorities
• Build upon the success of the Holiday Inn relaunch by continuing to improve the guest
experience, investing to drive guest consideration and differentiation between the Holiday
Inn brand family, particularly Holiday Inn and Holiday Inn Express, improving hotel
performance and unit growth;
• execute the multi-year programme to reposition Crowne Plaza Hotels & Resorts;
• activate growth in our newest brands by successfully launching EVEN Hotels and continuing
to accelerate growth from Hotel Indigo; and
• further deploy IHG tools throughout the franchised estate, across revenue management,
brand standards, channel management, Responsible Business practices and People Tools.
Business Review: Performance continued