Holiday Inn 2012 Annual Report Download - page 26
Download and view the complete annual report
Please find page 26 of the 2012 Holiday Inn annual report below. You can navigate through the pages in the report by either clicking on the pages listed below, or by using the keyword search tool below to find specific information within the annual report.-
 1
1 -
2
-
3
-
4
-
5
-
6
-
7
-
8
-
9
-
10
-
11
-
12
-
13
-
14
-
15
-
 16
16 -
 17
17 -
 18
18 -
 19
19 -
 20
20 -
 21
21 -
 22
22 -
 23
23 -
 24
24 -
 25
25 -
 26
26 -
 27
27 -
 28
28 -
 29
29 -
 30
30 -
 31
31 -
 32
32 -
 33
33 -
 34
34 -
 35
35 -
 36
36 -
37
-
38
-
39
-
40
-
41
-
42
-
43
-
44
-
45
-
46
-
47
-
48
-
49
-
50
-
51
-
52
-
53
-
54
-
55
-
56
-
57
-
58
-
59
-
60
-
61
-
62
-
63
-
64
-
65
-
66
-
67
-
68
-
69
-
70
-
71
-
72
-
73
-
74
-
75
-
76
-
77
-
78
-
79
-
80
-
81
-
82
-
83
-
84
-
85
-
86
-
87
-
88
-
89
-
90
-
91
-
92
-
93
-
94
-
95
-
96
-
97
-
98
-
99
-
100
-
101
-
102
-
103
-
104
-
105
-
106
-
107
-
108
-
109
-
110
-
111
-
112
-
113
-
114
-
115
-
116
-
117
-
118
-
119
-
120
-
121
-
122
-
123
-
124
-
125
-
126
-
127
-
128
-
129
-
130
-
131
-
132
-
133
-
134
-
135
-
136
-
137
-
138
-
139
-
140
-
141
-
142
-
143
-
144
 |
 |

24 IHG Annual Report and Financial Statements 2012
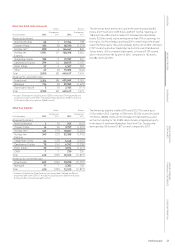
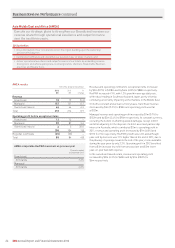
AMEA results
12 months ended 31 December
2012
$m
2011
$m
%
change
Revenue
Franchised 18 19 (5.3)
Managed 152 151 0.7
Owned and leased 48 46 4.3
Total 218 216 0.9
Operating profit before exceptional items
Franchised 12 12 –
Managed 90 87 3.4
Owned and leased 65 20.0
108 104 3.8
Regional overheads (20) (20) –
Total 88 84 4.8
AMEA comparable RevPAR movement on previous year
12 months ended
31 December 2012
Franchised
All brands 7.2%
Managed
All brands 4.6%
Revenue and operating profit before exceptional items increased
by $2m (0.9%) to $218m and by $4m (4.8%) to $88m respectively.
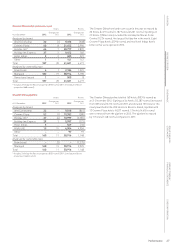
RevPAR increased 4.9%, with 1.2% growth in average daily rate,
with robust trading in Southeast Asia and Japan, partly offset by
continuing uncertainty impacting some markets in the Middle East.
On both a constant and actual currency basis, franchised revenue
decreased by $1m (5.3%) to $18m and operating profit was flat
at $12m.
Managed revenue and operating profit increased by $1m (0.7%) to
$152m and by $3m (3.4%) to $90m respectively. At constant currency,
excluding the benefit of a $6m liquidated damages receipt in 2011
and after adjusting for the disposal of a hotel asset and partnership
interest in Australia, which contributed $3m to operating profit in
2011, revenue and operating profit increased by $7m (4.8%) and
$11m (14.1%) respectively. RevPAR growth was 4.6% and although
year-end System size was 7.1% higher than at the end of 2011, due to
the phasing of openings towards the end of the year, rooms available
during the year grew by only 2.2%. Operating profit in 2012 benefited
from a $1m increase in profit from an associate and $2m lower
year-on-year bad debt expense.
In the owned and leased estate, revenue and operating profit
increased by $2m (4.3%) to $48m and by $1m (20.0%) to
$6m respectively.
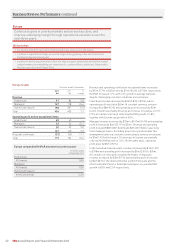
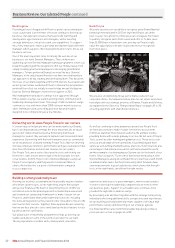
Asia Middle East and Africa (AMEA)
Execute our strategic plans to strengthen our Brands and increase our
revenue share through operational excellence and outperformance
over the next three years.
2013 priorities
• Grow distribution of our core brands across the region, building upon the leadership
position of Holiday Inn;
• build preferred Brands and strengthen our position in key strategic markets; and
• deliver operational excellence and outperformance at our hotels by embedding revenue
driving tools and, where appropriate, localising brands, channels, Responsible Business
practices and People Tools.
Business Review: Performance continued