Holiday Inn 2012 Annual Report Download - page 141
Download and view the complete annual report
Please find page 141 of the 2012 Holiday Inn annual report below. You can navigate through the pages in the report by either clicking on the pages listed below, or by using the keyword search tool below to find specific information within the annual report.-
 1
1 -
2
-
3
-
4
-
5
-
6
-
7
-
8
-
9
-
10
-
11
-
12
-
13
-
14
-
15
-
16
-
17
-
18
-
19
-
20
-
21
-
22
-
23
-
24
-
25
-
26
-
27
-
28
-
29
-
30
-
31
-
32
-
33
-
34
-
35
-
36
-
37
-
38
-
39
-
40
-
41
-
42
-
43
-
44
-
45
-
46
-
47
-
48
-
49
-
50
-
51
-
52
-
53
-
54
-
55
-
56
-
57
-
58
-
59
-
60
-
61
-
62
-
63
-
64
-
65
-
66
-
67
-
68
-
69
-
70
-
71
-
72
-
73
-
74
-
75
-
76
-
77
-
78
-
79
-
80
-
81
-
82
-
83
-
84
-
85
-
86
-
87
-
88
-
89
-
90
-
91
-
92
-
93
-
94
-
95
-
96
-
97
-
98
-
99
-
100
-
101
-
102
-
103
-
104
-
105
-
106
-
107
-
108
-
109
-
110
-
111
-
112
-
113
-
114
-
115
-
116
-
117
-
118
-
119
-
120
-
121
-
122
-
123
-
124
-
125
-
126
-
127
-
128
-
129
-
130
-
 131
131 -
 132
132 -
 133
133 -
 134
134 -
 135
135 -
 136
136 -
 137
137 -
 138
138 -
 139
139 -
 140
140 -
 141
141 -
 142
142 -
 143
143 -
 144
144
 |
 |

OTHER INFORMATIONOVERVIEW BUSINESS OVERVIEW GOVERNANCE
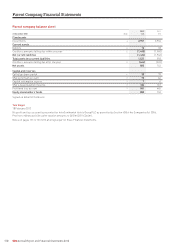
PARENT COMPANY
FINANCIAL STATEMENTS
GROUP FINANCIAL
STATEMENTS
Investor information, Dividend history and Five year history 139
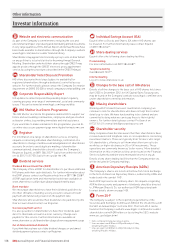
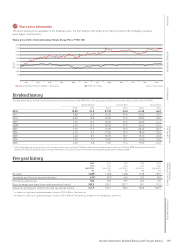
Share price information
The latest share price is available in the financial press. Further details of the share price may be found on the Company’s website
www.ihgplc.com/investors
Jan Feb Mar Apr May Jun Jul Aug Sep Oct Nov Dec
Source: Datastream
InterContinental Hotels Group PLC – Share priceFTSE 100 – Index
Share price 2012: InterContinental Hotels Group PLC v FTSE 100
(pence)
1,800
1,700
1,600
1,500
1,400
1,300
1,200
1,100
1,000
900
Dividend history
The table below details the interim and final dividends per share (pence) and per ADR (cents), excluding special dividends and capital returns, paid by IHG since 2003.
Interim dividend Final dividend Total dividend
pence cents pence cents pence cents
2012 13.50 21.0 27.70 43.0 41.20 64.0
2011 9.80 16.0 24.70 39.0 34.50 55.0
2010 8.00 12.8 22.00 35.2 30.00 48.0
2009 7.30 12.2 18.70 29.2 26.00 41.4
2008* 6.40 12.2 20.20 29.2 26.60 41.4
2007 5.70 11.5 14.90 29.2 20.60 40.7
2006 5.10 9.6 13.30 25.9 18.40 35.5
2005 4.60 8.1 10.70 18.7 15.30 26.8
2004 4.30 7.7 10.00 19.1 14.30 26.8
2003 4.05 6.8 9.45 17.4 13.50 24.2
* IHG changed the reporting currency of its Group accounts from sterling to US dollars effective from the half-year results as at 30 June 2008. Starting with the interim
dividend for 2008, all dividends have first been determined in US dollars and converted into sterling immediately before announcement.
Five year history
2012 2011 2010 2009 2008
Total Total Total Total Total
operations operations operations operations operations
$m $m $m $m $m
Revenue 1,835* 1,768† 1,628 1,538 1,897
Operating profit before exceptional items 614* 559† 444 363 549
Profit/(loss) before tax 556 532 397 (64) 316
Basic earnings per share from total operations (cents) 189.5 159.2 101.7 74.7 91.3
Adjusted earnings per share from total operations (cents) 141.5 130.4 98.6 102.8 120.9
* Includes one significant liquidated damages receipt in 2012 of $3m in The Americas.
† Includes two significant liquidated damages receipts in 2011; $10m in The Americas and $6m in Asia, Middle East and Africa.