Holiday Inn 2012 Annual Report Download - page 101
Download and view the complete annual report
Please find page 101 of the 2012 Holiday Inn annual report below. You can navigate through the pages in the report by either clicking on the pages listed below, or by using the keyword search tool below to find specific information within the annual report.-
 1
1 -
2
-
3
-
4
-
5
-
6
-
7
-
8
-
9
-
10
-
11
-
12
-
13
-
14
-
15
-
16
-
17
-
18
-
19
-
20
-
21
-
22
-
23
-
24
-
25
-
26
-
27
-
28
-
29
-
30
-
31
-
32
-
33
-
34
-
35
-
36
-
37
-
38
-
39
-
40
-
41
-
42
-
43
-
44
-
45
-
46
-
47
-
48
-
49
-
50
-
51
-
52
-
53
-
54
-
55
-
56
-
57
-
58
-
59
-
60
-
61
-
62
-
63
-
64
-
65
-
66
-
67
-
68
-
69
-
70
-
71
-
72
-
73
-
74
-
75
-
76
-
77
-
78
-
79
-
80
-
81
-
82
-
83
-
84
-
85
-
86
-
87
-
88
-
89
-
90
-
 91
91 -
 92
92 -
 93
93 -
 94
94 -
 95
95 -
 96
96 -
 97
97 -
 98
98 -
 99
99 -
 100
100 -
 101
101 -
 102
102 -
 103
103 -
 104
104 -
 105
105 -
 106
106 -
 107
107 -
 108
108 -
 109
109 -
 110
110 -
 111
111 -
112
-
113
-
114
-
115
-
116
-
117
-
118
-
119
-
120
-
121
-
122
-
123
-
124
-
125
-
126
-
127
-
128
-
129
-
130
-
131
-
132
-
133
-
134
-
135
-
136
-
137
-
138
-
139
-
140
-
141
-
142
-
143
-
144
 |
 |

OVERVIEW BUSINESS REVIEW GOVERNANCE
GROUP FINANCIAL
STATEMENTS
PARENT COMPANY
FINANCIAL STATEMENTS OTHER INFORMATION
Notes to the Group Financial Statements 99
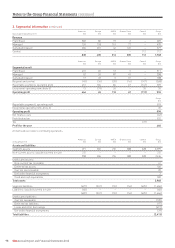
2. Segmental information continued
Americas Europe AMEA Greater China Central Group
Year ended 31 December 2011 $m $m $m $m $m $m
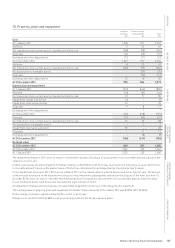
Other segmental information
Capital expenditure (see below) 84 15 14 8 72 193
Non-cash items:
Depreciation and amortisation* 23 24 16 16 20 99
Impairment losses – 2 3 – – 5
Reversal of previously recorded impairment (25) – – – – (25)
Share-based payments cost – – – – 25 25
Share of profit of associates and joint ventures – – (1) – – (1)
* Included in the $99m of depreciation and amortisation is $30m relating to administrative expenses and $69m relating to cost of sales.
Americas Europe AMEA Greater China Central Group
Year ended 31 December 2011 $m $m $m $m $m $m
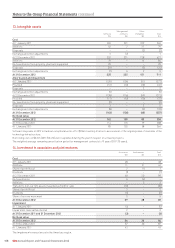
Reconciliation of capital expenditure
Capital expenditure per management reporting 84 15 14 8 72 193
Management contract acquired on disposal 2 – – – – 2
Timing differences 2 – – 2 – 4
Capital expenditure per the Financial Statements 88 15 14 10 72 199
Comprising additions to:
Property, plant and equipment 6 12 2 10 26 56
Intangible assets 30 3 – – 46 79
Investments in associates and joint ventures 31 – 11 – – 42
Other financial assets 21 – 1 – – 22
88 15 14 10 72 199
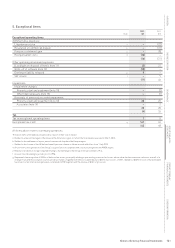
Year ended Year ended
31 December 31 December
2012 2011
Geographical information $m $m
Revenue
United Kingdom 152 139
United States 769 740
People’s Republic of China (including Hong Kong) 238 210
Rest of World 676 679
1,835 1,768
For the purposes of the above table, hotel revenue is determined according to the location of the hotel and other revenue is attributed to the
country of origin. In addition to the United Kingdom, revenue relating to an individual country is separately disclosed when it represents 10%
or more of total revenue.
31 December 31 December
2012 2011
$m $m
Non-current assets
United Kingdom 78 361
United States 590 559
France 329 328
People’s Republic of China (including Hong Kong) 333 331
Rest of World 257 270
1,587 1,849
For the purposes of the above table, non-current assets comprise property, plant and equipment, goodwill, intangible assets and
investments in associates and joint ventures. Non-current assets relating to an individual country are separately disclosed when they
represent 10% or more of total non-current assets, as defined above.