Holiday Inn 2012 Annual Report Download - page 18
Download and view the complete annual report
Please find page 18 of the 2012 Holiday Inn annual report below. You can navigate through the pages in the report by either clicking on the pages listed below, or by using the keyword search tool below to find specific information within the annual report.-
 1
1 -
2
-
3
-
4
-
5
-
6
-
7
-
 8
8 -
 9
9 -
 10
10 -
 11
11 -
 12
12 -
 13
13 -
 14
14 -
 15
15 -
 16
16 -
 17
17 -
 18
18 -
 19
19 -
 20
20 -
 21
21 -
 22
22 -
 23
23 -
 24
24 -
 25
25 -
 26
26 -
 27
27 -
 28
28 -
29
-
30
-
31
-
32
-
33
-
34
-
35
-
36
-
37
-
38
-
39
-
40
-
41
-
42
-
43
-
44
-
45
-
46
-
47
-
48
-
49
-
50
-
51
-
52
-
53
-
54
-
55
-
56
-
57
-
58
-
59
-
60
-
61
-
62
-
63
-
64
-
65
-
66
-
67
-
68
-
69
-
70
-
71
-
72
-
73
-
74
-
75
-
76
-
77
-
78
-
79
-
80
-
81
-
82
-
83
-
84
-
85
-
86
-
87
-
88
-
89
-
90
-
91
-
92
-
93
-
94
-
95
-
96
-
97
-
98
-
99
-
100
-
101
-
102
-
103
-
104
-
105
-
106
-
107
-
108
-
109
-
110
-
111
-
112
-
113
-
114
-
115
-
116
-
117
-
118
-
119
-
120
-
121
-
122
-
123
-
124
-
125
-
126
-
127
-
128
-
129
-
130
-
131
-
132
-
133
-
134
-
135
-
136
-
137
-
138
-
139
-
140
-
141
-
142
-
143
-
144
 |
 |

16 IHG Annual Report and Financial Statements 2012
In particular, we use the following measures to monitor our
performance:
• fee revenue and fee based margins;
• global RevPAR;
• system contribution – the proportion of business delivered to our
hotels by our dedicated IHG booking channels;
• employee engagement; and
• Responsible Business practices.
These KPIs are used to measure the progress of our Group to deliver
Great Hotels Guests Love and achieve our Vision of becoming one of
the great companies in the world.
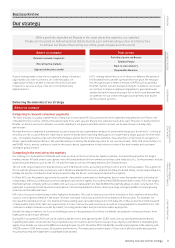
We have a holistic set of carefully selected key performance
indicators (KPIs) to monitor our success in achieving our strategy.
These are organised around the elements of our strategy:
• ‘Where we compete’, focussing on relevant consumer segments,
the most attractive markets and the appropriate business
model; and
• ‘How we win’, focussing on our corporate priorities of preferred
Brands, talented People, best-in-class Delivery and
Responsible Business.
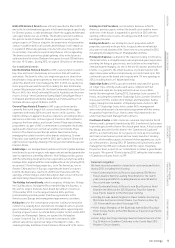
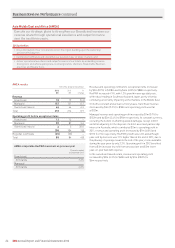
Where we compete
Strategic priorities KPIs
Current status and
2012 development 2013 priorities
Most attractive markets and
appropriate business model
To accelerate profitable growth
of our core business in our
most attractive markets where
presence and scale really count
using the right business model
to drive our fee revenue and
income streams.
Net rooms supply
647,161 658,348 675,982
2010 2011 2012
• System size grown to 675,982
rooms;
• 4,602 hotels open globally;
• built scale of Hotel Indigo brand
to 50 hotels globally; and
• fee based margins of 42.6%, up
two percentage points on 2011,
a particularly strong result.
• Accelerate growth strategies in
quality locations in agreed scale
markets; and
• continue to leverage scale.
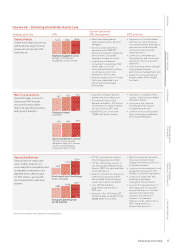
How we win – Delivering Great Hotels Guests Love
Strategic priorities KPIs
Current status and
2012 development 2013 priorities
Preferred Brands
Operate a portfolio of preferred,
locally-relevant brands
attractive to both owners and
guests that have clear market
positions and differentiation in
the eyes of the guest.
Global RevPAR growth/(decline)
Comparable hotels, constant $
6.2%
5.2%
6.2%
201220112010
• Clarified the brand propositions
for Holiday Inn and Holiday Inn
Express and celebrated the
Holiday Inn 60th anniversary;
• continued the repositioning
of Crowne Plaza;
• achieved two new brand launches
in two geographies; and
• achieved strong brand successes
in Greater China, particularly
through the growth of HUALUXE
Hotels & Resorts with 15 signings
for the brand and improved the
strength of Crowne Plaza through
brand preference and awareness.
• Invest to build long-term brand
preference for the Holiday Inn
brand family;
• continue the repositioning of
the Crowne Plaza brand;
• support growth of our new
brands: EVEN Hotels in the US
and HUALUXE Hotels & Resorts
in Greater China; and
• continue to deliver a consistent
brand experience and increased
guest satisfaction through our
needs-based segmentation
analysis.
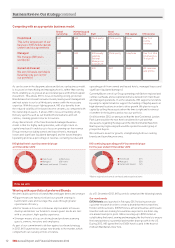
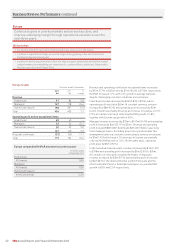
Our performance against our KPIs over the 2010-2012 period is summarised below:
Growth in fee revenue1
available
le
lab
avai
a
ble
ail
a
2010 2011 2012
Fee based margins
42.6%
40.6%2
35.7%
2011 20122010
1 At constant currency.
2 One percentage point growth on an underlying basis.
Business Review
Measuring our success