Comcast 2015 Annual Report Download - page 94
Download and view the complete annual report
Please find page 94 of the 2015 Comcast annual report below. You can navigate through the pages in the report by either clicking on the pages listed below, or by using the keyword search tool below to find specific information within the annual report.-
 1
1 -
2
-
3
-
4
-
5
-
6
-
7
-
8
-
9
-
10
-
11
-
12
-
13
-
14
-
15
-
16
-
17
-
18
-
19
-
20
-
21
-
22
-
23
-
24
-
25
-
26
-
27
-
28
-
29
-
30
-
31
-
32
-
33
-
34
-
35
-
36
-
37
-
38
-
39
-
40
-
41
-
42
-
43
-
44
-
45
-
46
-
47
-
48
-
49
-
50
-
51
-
52
-
53
-
54
-
55
-
56
-
57
-
58
-
59
-
60
-
61
-
62
-
63
-
64
-
65
-
66
-
67
-
68
-
69
-
70
-
71
-
72
-
73
-
74
-
75
-
76
-
77
-
78
-
79
-
80
-
81
-
82
-
83
-
 84
84 -
 85
85 -
 86
86 -
 87
87 -
 88
88 -
 89
89 -
 90
90 -
 91
91 -
 92
92 -
 93
93 -
 94
94 -
 95
95 -
 96
96 -
 97
97 -
 98
98 -
 99
99 -
 100
100 -
 101
101 -
 102
102 -
 103
103 -
 104
104 -
105
-
106
-
107
-
108
-
109
-
110
-
111
-
112
-
113
-
114
-
115
-
116
-
117
-
118
-
119
-
120
-
121
-
122
-
123
-
124
-
125
-
126
-
127
-
128
-
129
-
130
-
131
-
132
-
133
-
134
-
135
-
136
-
137
-
138
-
139
-
140
-
141
-
142
-
143
-
144
-
145
-
146
-
147
-
148
-
149
-
150
-
151
-
152
-
153
-
154
-
155
-
156
-
157
-
158
-
159
-
160
-
161
-
162
-
163
-
164
-
165
-
166
-
167
-
168
-
169
-
170
-
171
-
172
-
173
-
174
-
175
-
176
-
177
-
178
 |
 |

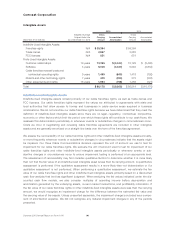
Comcast Corporation
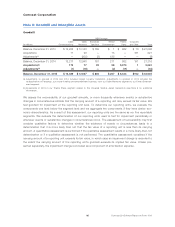
Investment Income (Loss), Net
Year ended December 31 (in millions) 2015 2014 2013
Gains on sales and exchanges of investments, net $12 $ 192 $ 484
Investment impairment losses (59) (50) (29)
Unrealized gains on securities underlying prepaid forward sale agreements 42 66 1,601
Mark to market adjustments on derivative component of prepaid forward sale
agreements and indexed debt instruments (42) (56) (1,604)
Interest and dividend income 115 116 111
Other, net 13 28 13
Investment income (loss), net $81 $ 296 $ 576
Fair Value Method
We classify publicly traded investments that are not accounted for under the equity method as available-for-
sale (“AFS”) or trading securities and record them at fair value. For AFS securities, we record unrealized gains
or losses resulting from changes in fair value between measurement dates as a component of other compre-
hensive income (loss), except when we consider declines in value to be other than temporary. For trading
securities, we record unrealized gains or losses resulting from changes in fair value between measurement
dates as a component of investment income (loss), net. We recognize realized gains and losses associated
with our fair value method investments using the specific identification method. We classify the cash flows
related to purchases of and proceeds from the sale of trading securities based on the nature of the securities
and the purpose for which they were acquired.
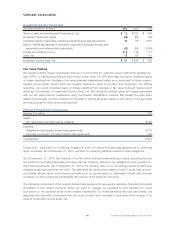
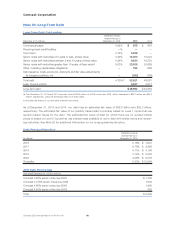
Prepaid Forward Sale Agreements
December 31 (in millions) 2014
Assets:
Fair value equity securities held as collateral $ 523
Liabilities:
Obligations under prepaid forward sale agreements $ 119
Derivative component of prepaid forward sale agreements 356
Total liabilities $ 475
During 2015, we settled our remaining obligations under our prepaid forward sale agreements by delivering
equity securities. As of December 31, 2015, we have no remaining liabilities related to these obligations.
As of December 31, 2014, the majority of our fair value method investments were equity securities that we
accounted for as trading securities and were held as collateral related to our obligations under prepaid for-
ward sale agreements. As of December 31, 2014, the carrying value of our remaining prepaid forward sale
obligations approximated their fair value. The estimated fair values were based on Level 2 inputs that use pric-
ing models whose inputs were derived primarily from or corroborated by observable market data through
correlation or other means for substantially the full term of the financial instrument.
The derivative component of the prepaid forward sale agreements were equity derivative financial instruments
embeddedintherelatedcontracts,whichweusedto manage our exposure to and benefits from price
fluctuations in the common stock of the related investments. For these derivative financial instruments, we
separated the derivative component from the host contract and recorded in each period the change in its
value to investment income (loss), net.
91 Comcast 2015 Annual Report on Form 10-K