Comcast 2015 Annual Report Download - page 80
Download and view the complete annual report
Please find page 80 of the 2015 Comcast annual report below. You can navigate through the pages in the report by either clicking on the pages listed below, or by using the keyword search tool below to find specific information within the annual report.-
 1
1 -
2
-
3
-
4
-
5
-
6
-
7
-
8
-
9
-
10
-
11
-
12
-
13
-
14
-
15
-
16
-
17
-
18
-
19
-
20
-
21
-
22
-
23
-
24
-
25
-
26
-
27
-
28
-
29
-
30
-
31
-
32
-
33
-
34
-
35
-
36
-
37
-
38
-
39
-
40
-
41
-
42
-
43
-
44
-
45
-
46
-
47
-
48
-
49
-
50
-
51
-
52
-
53
-
54
-
55
-
56
-
57
-
58
-
59
-
60
-
61
-
62
-
63
-
64
-
65
-
66
-
67
-
68
-
69
-
 70
70 -
 71
71 -
 72
72 -
 73
73 -
 74
74 -
 75
75 -
 76
76 -
 77
77 -
 78
78 -
 79
79 -
 80
80 -
 81
81 -
 82
82 -
 83
83 -
 84
84 -
 85
85 -
 86
86 -
 87
87 -
 88
88 -
 89
89 -
 90
90 -
91
-
92
-
93
-
94
-
95
-
96
-
97
-
98
-
99
-
100
-
101
-
102
-
103
-
104
-
105
-
106
-
107
-
108
-
109
-
110
-
111
-
112
-
113
-
114
-
115
-
116
-
117
-
118
-
119
-
120
-
121
-
122
-
123
-
124
-
125
-
126
-
127
-
128
-
129
-
130
-
131
-
132
-
133
-
134
-
135
-
136
-
137
-
138
-
139
-
140
-
141
-
142
-
143
-
144
-
145
-
146
-
147
-
148
-
149
-
150
-
151
-
152
-
153
-
154
-
155
-
156
-
157
-
158
-
159
-
160
-
161
-
162
-
163
-
164
-
165
-
166
-
167
-
168
-
169
-
170
-
171
-
172
-
173
-
174
-
175
-
176
-
177
-
178
 |
 |

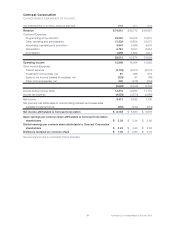
Comcast Corporation
Consolidated Statement of Income
Year ended December 31 (in millions, except per share data) 2015 2014 2013
Revenue $ 74,510 $ 68,775 $ 64,657
Costs and Expenses:
Programming and production 22,550 20,912 19,670
Other operating and administrative 21,339 19,854 18,575
Advertising, marketing and promotion 5,943 5,086 4,978
Depreciation 6,781 6,337 6,254
Amortization 1,899 1,682 1,617
58,512 53,871 51,094
Operating income 15,998 14,904 13,563
Other Income (Expense):
Interest expense (2,702) (2,617) (2,574)
Investment income (loss), net 81 296 576
Equity in net income (losses) of investees, net (325) 97 (86)
Other income (expense), net 320 (215) (364)
(2,626) (2,439) (2,448)
Income before income taxes 13,372 12,465 11,115
Income tax expense (4,959) (3,873) (3,980)
Net income 8,413 8,592 7,135
Net (income) loss attributable to noncontrolling interests and redeemable
subsidiary preferred stock (250) (212) (319)
Net income attributable to Comcast Corporation $ 8,163 $ 8,380 $ 6,816
Basic earnings per common share attributable to Comcast Corporation
shareholders $ 3.28 $ 3.24 $ 2.60
Diluted earnings per common share attributable to Comcast Corporation
shareholders $ 3.24 $ 3.20 $ 2.56
Dividends declared per common share $ 1.00 $ 0.90 $ 0.78
See accompanying notes to consolidated financial statements.
77 Comcast 2011 Annual Report on Form 10-K