Comcast 2015 Annual Report Download - page 47
Download and view the complete annual report
Please find page 47 of the 2015 Comcast annual report below. You can navigate through the pages in the report by either clicking on the pages listed below, or by using the keyword search tool below to find specific information within the annual report.-
 1
1 -
2
-
3
-
4
-
5
-
6
-
7
-
8
-
9
-
10
-
11
-
12
-
13
-
14
-
15
-
16
-
17
-
18
-
19
-
20
-
21
-
22
-
23
-
24
-
25
-
26
-
27
-
28
-
29
-
30
-
31
-
32
-
33
-
34
-
35
-
36
-
 37
37 -
 38
38 -
 39
39 -
 40
40 -
 41
41 -
 42
42 -
 43
43 -
 44
44 -
 45
45 -
 46
46 -
 47
47 -
 48
48 -
 49
49 -
 50
50 -
 51
51 -
 52
52 -
 53
53 -
 54
54 -
 55
55 -
 56
56 -
 57
57 -
58
-
59
-
60
-
61
-
62
-
63
-
64
-
65
-
66
-
67
-
68
-
69
-
70
-
71
-
72
-
73
-
74
-
75
-
76
-
77
-
78
-
79
-
80
-
81
-
82
-
83
-
84
-
85
-
86
-
87
-
88
-
89
-
90
-
91
-
92
-
93
-
94
-
95
-
96
-
97
-
98
-
99
-
100
-
101
-
102
-
103
-
104
-
105
-
106
-
107
-
108
-
109
-
110
-
111
-
112
-
113
-
114
-
115
-
116
-
117
-
118
-
119
-
120
-
121
-
122
-
123
-
124
-
125
-
126
-
127
-
128
-
129
-
130
-
131
-
132
-
133
-
134
-
135
-
136
-
137
-
138
-
139
-
140
-
141
-
142
-
143
-
144
-
145
-
146
-
147
-
148
-
149
-
150
-
151
-
152
-
153
-
154
-
155
-
156
-
157
-
158
-
159
-
160
-
161
-
162
-
163
-
164
-
165
-
166
-
167
-
168
-
169
-
170
-
171
-
172
-
173
-
174
-
175
-
176
-
177
-
178
 |
 |
• the deployment of wireless gateways to more than 70% of our residential high-
speed Internet customers
• the improvement of our network infrastructure to increase network capacity
• the expansion of our business services, including the creation of the new enter-
prise service offering designed to serve certain Fortune 1000 companies and
other large nationwide enterprises with multiple locations
• Investments to improve the customer experience, including by hiring additional
personnel and developing and deploying various technology and software tools
NBCUniversal Segments
• An increase in total NBCUniversal revenue of 11.9% to $28.5 billion
• An increase in total NBCUniversal operating income before depreciation and amor-
tization of 14.8% to $6.4 billion
• An increase in our Filmed Entertainment segment revenue of 45.5% largely due to the
success of Furious 7,Jurassic World and Minions, which each exceeded $1 billion in
worldwide theatrical receipts
• An increase in our Theme Parks segment revenue of 27.3% due to the continued
success of attractions at our Universal theme parks, including The Wizarding World of
Harry Potter™—Diagon Alley™ in Orlando and the Fast & Furious™—
Supercharged™ studio tour in Hollywood
• The continued investment in original programming and sports programming rights at
both our cable networks and broadcast television networks, including the premiere of
NASCAR programming
• The acquisition of a 51% interest in Universal Studios Japan for $1.5 billion
Competition
The results of operations of our reportable business segments are affected by competition, as all of our busi-
nesses operate in intensely competitive, consumer-driven and rapidly changing environments and compete
with a growing number of companies that provide a broad range of communications products and services
and entertainment, news and information content to consumers.
For additional information on the competition our businesses face, see Item 1A: Risk Factors and refer to the
risk factors entitled “Our businesses currently face a wide range of competition, and our businesses and
results of operations could be adversely affected if we do not compete effectively” and “Changes in consumer
behavior driven by alternative methods for viewing content may adversely affect our businesses and challenge
existing business models” within that section.
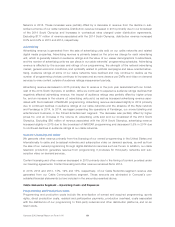
Seasonality and Cyclicality
Each of our businesses is subject to seasonal and cyclical variations. In our Cable Communications segment,
our results are impacted by the seasonal nature of customers receiving our cable services in college and
vacation markets. This generally results in a reduction in net customer additions in the second quarter and an
increase in net customer additions in the third and fourth quarters of each year.
Revenue in our Cable Communications, Cable Networks and Broadcast Television segments is subject to
cyclical advertising patterns and changes in viewership levels. Our U.S. advertising revenue is generally higher
Comcast 2015 Annual Report on Form 10-K 44