Comcast 2015 Annual Report Download - page 151
Download and view the complete annual report
Please find page 151 of the 2015 Comcast annual report below. You can navigate through the pages in the report by either clicking on the pages listed below, or by using the keyword search tool below to find specific information within the annual report.-
 1
1 -
2
-
3
-
4
-
5
-
6
-
7
-
8
-
9
-
10
-
11
-
12
-
13
-
14
-
15
-
16
-
17
-
18
-
19
-
20
-
21
-
22
-
23
-
24
-
25
-
26
-
27
-
28
-
29
-
30
-
31
-
32
-
33
-
34
-
35
-
36
-
37
-
38
-
39
-
40
-
41
-
42
-
43
-
44
-
45
-
46
-
47
-
48
-
49
-
50
-
51
-
52
-
53
-
54
-
55
-
56
-
57
-
58
-
59
-
60
-
61
-
62
-
63
-
64
-
65
-
66
-
67
-
68
-
69
-
70
-
71
-
72
-
73
-
74
-
75
-
76
-
77
-
78
-
79
-
80
-
81
-
82
-
83
-
84
-
85
-
86
-
87
-
88
-
89
-
90
-
91
-
92
-
93
-
94
-
95
-
96
-
97
-
98
-
99
-
100
-
101
-
102
-
103
-
104
-
105
-
106
-
107
-
108
-
109
-
110
-
111
-
112
-
113
-
114
-
115
-
116
-
117
-
118
-
119
-
120
-
121
-
122
-
123
-
124
-
125
-
126
-
127
-
128
-
129
-
130
-
131
-
132
-
133
-
134
-
135
-
136
-
137
-
138
-
139
-
140
-
 141
141 -
 142
142 -
 143
143 -
 144
144 -
 145
145 -
 146
146 -
 147
147 -
 148
148 -
 149
149 -
 150
150 -
 151
151 -
 152
152 -
 153
153 -
 154
154 -
 155
155 -
 156
156 -
 157
157 -
 158
158 -
 159
159 -
 160
160 -
 161
161 -
162
-
163
-
164
-
165
-
166
-
167
-
168
-
169
-
170
-
171
-
172
-
173
-
174
-
175
-
176
-
177
-
178
 |
 |

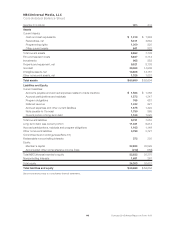
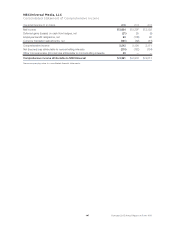
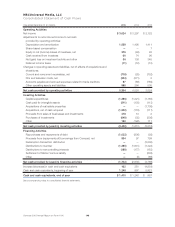
NBCUniversal Media, LLC
Consolidated Statement of Cash Flows
Year ended December 31 (in millions) 2015 2014 2013
Operating Activities
Net income $ 3,624 $ 3,297 $ 2,122
Adjustments to reconcile net income to net cash
provided by operating activities:
Depreciation and amortization 1,539 1,495 1,411
Share-based compensation ——7
Equity in net (income) losses of investees, net 376 (46) 93
Cash received from investees 60 74 90
Net (gain) loss on investment activity and other 56 136 345
Deferred income taxes (11) (12) (10)
Changes in operating assets and liabilities, net of effects of acquisitions and
divestitures:
Current and noncurrent receivables, net (718) (25) (752)
Film and television costs, net (304) (571) 2
Accounts payable and accrued expenses related to trade creditors 97 (88) (789)
Other operating assets and liabilities 585 264 505
Net cash provided by operating activities 5,304 4,524 3,024
Investing Activities
Capital expenditures (1,386) (1,221) (1,160)
Cash paid for intangible assets (211) (130) (113)
Acquisitions of real estate properties —— (1,705)
Acquisitions, net of cash acquired (1,522) (118) (111)
Proceeds from sales of businesses and investments 218 13 2
Purchases of investments (649) (35) (236)
Other 150 (122) 111
Net cash provided by (used in) investing activities (3,400) (1,613) (3,212)
Financing Activities
Repurchases and repayments of debt (1,022) (906) (92)
Proceeds from (repayments of) borrowings from Comcast, net 854 97 799
Redemption transaction distribution —— (3,200)
Distributions to member (1,385) (1,641) (1,422)
Distributions to noncontrolling interests (189) (177) (183)
Settlement of Station Venture liability —— (602)
Other —(3) (66)
Net cash provided by (used in) financing activities (1,742) (2,630) (4,766)
Increase (decrease) in cash and cash equivalents 162 281 (4,954)
Cash and cash equivalents, beginning of year 1,248 967 5,921
Cash and cash equivalents, end of year $ 1,410 $ 1,248 $ 967
See accompanying notes to consolidated financial statements.
Comcast 2015 Annual Report on Form 10-K 148