Comcast 2015 Annual Report Download - page 62
Download and view the complete annual report
Please find page 62 of the 2015 Comcast annual report below. You can navigate through the pages in the report by either clicking on the pages listed below, or by using the keyword search tool below to find specific information within the annual report.-
 1
1 -
2
-
3
-
4
-
5
-
6
-
7
-
8
-
9
-
10
-
11
-
12
-
13
-
14
-
15
-
16
-
17
-
18
-
19
-
20
-
21
-
22
-
23
-
24
-
25
-
26
-
27
-
28
-
29
-
30
-
31
-
32
-
33
-
34
-
35
-
36
-
37
-
38
-
39
-
40
-
41
-
42
-
43
-
44
-
45
-
46
-
47
-
48
-
49
-
50
-
51
-
 52
52 -
 53
53 -
 54
54 -
 55
55 -
 56
56 -
 57
57 -
 58
58 -
 59
59 -
 60
60 -
 61
61 -
 62
62 -
 63
63 -
 64
64 -
 65
65 -
 66
66 -
 67
67 -
 68
68 -
 69
69 -
 70
70 -
 71
71 -
 72
72 -
73
-
74
-
75
-
76
-
77
-
78
-
79
-
80
-
81
-
82
-
83
-
84
-
85
-
86
-
87
-
88
-
89
-
90
-
91
-
92
-
93
-
94
-
95
-
96
-
97
-
98
-
99
-
100
-
101
-
102
-
103
-
104
-
105
-
106
-
107
-
108
-
109
-
110
-
111
-
112
-
113
-
114
-
115
-
116
-
117
-
118
-
119
-
120
-
121
-
122
-
123
-
124
-
125
-
126
-
127
-
128
-
129
-
130
-
131
-
132
-
133
-
134
-
135
-
136
-
137
-
138
-
139
-
140
-
141
-
142
-
143
-
144
-
145
-
146
-
147
-
148
-
149
-
150
-
151
-
152
-
153
-
154
-
155
-
156
-
157
-
158
-
159
-
160
-
161
-
162
-
163
-
164
-
165
-
166
-
167
-
168
-
169
-
170
-
171
-
172
-
173
-
174
-
175
-
176
-
177
-
178
 |
 |

Other operating and administrative expenses increased slightly in 2015 due to increased expenses asso-
ciated with our larger film slate. Other operating and administrative expenses increased in 2014 primarily due
to the inclusion of Fandango, which was previously presented in our Cable Networks segment.
Advertising, Marketing and Promotion Expenses
Advertising, marketing and promotion expenses consist primarily of expenses associated with advertising for
our theatrical releases and the marketing of our films on DVD and in digital formats. We incur significant
marketing expenses before and throughout the release of a film in movie theaters. As a result, we typically
incur losses on a film prior to and during the film’s exhibition in movie theaters and may not realize profits, if
any, until the film generates home entertainment and content licensing revenue. The costs associated with
producing and marketing films have generally increased in recent years and may continue to increase in the
future.
Advertising, marketing and promotion expenses increased in 2015 primarily due to higher promotional costs
associated with our larger 2015 film slate and increased advertising expenses for Fandango. Advertising,
marketing and promotion expenses decreased in 2014 primarily due to fewer major film releases compared to
2013.
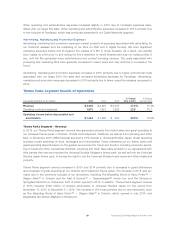
Theme Parks Segment Results of Operations
Year ended December 31 (in millions) 2015 2014 2013
% Change
2014 to 2015
% Change
2013 to 2014
Revenue $ 3,339 $ 2,623 $ 2,235 27.3% 17.3%
Operating costs and expenses 1,875 1,527 1,292 22.8 18.1
Operating income before depreciation and
amortization $ 1,464 $ 1,096 $ 943 33.5% 16.3%
Theme Parks Segment – Revenue
In 2015, our Theme Parks segment revenue was generated primarily from ticket sales and guest spending at
our Universal theme parks in Orlando, Florida and Hollywood, California, as well as from licensing and other
fees. In November 2015, NBCUniversal acquired a 51% interest in Universal Studios Japan. Guest spending
includes in-park spending on food, beverages and merchandise. Guest attendance at our theme parks and
guest spending depend heavily on the general environment for travel and tourism, including consumer spend-
ing on travel and other recreational activities. Licensing and other fees relate primarily to our agreements with
third parties that own and operate the Universal Studios Singapore theme park, as well as from the Universal
Studios Japan theme park, to license the right to use the Universal Studios brand name and other intellectual
property.
Theme Parks segment revenue increased in 2015 and 2014 primarily due to increases in guest attendance
and increases in guest spending at our Orlando and Hollywood theme parks. The increase in 2015 was pri-
marily due to the continued success of our attractions, including The Wizarding World of Harry Potter™ —
Diagon Alley™ in Orlando and the Fast & Furious™ — Supercharged™ studio tour and The Simpson’s
Springfield attraction in Hollywood, both of which opened in 2015. In addition, Theme Parks segment revenue
in 2015 includes $169 million of revenue attributable to Universal Studios Japan for the period from
November 13, 2015 to December 31, 2015. The increase in 2014 was primarily due to new attractions, such
as The Wizarding World of Harry Potter™ — Diagon Alley™ in Orlando, which opened in July 2014, and
Despicable Me: Minion Mayhem in Hollywood.
59 Comcast 2015 Annual Report on Form 10-K