Comcast 2015 Annual Report Download - page 56
Download and view the complete annual report
Please find page 56 of the 2015 Comcast annual report below. You can navigate through the pages in the report by either clicking on the pages listed below, or by using the keyword search tool below to find specific information within the annual report.-
 1
1 -
2
-
3
-
4
-
5
-
6
-
7
-
8
-
9
-
10
-
11
-
12
-
13
-
14
-
15
-
16
-
17
-
18
-
19
-
20
-
21
-
22
-
23
-
24
-
25
-
26
-
27
-
28
-
29
-
30
-
31
-
32
-
33
-
34
-
35
-
36
-
37
-
38
-
39
-
40
-
41
-
42
-
43
-
44
-
45
-
 46
46 -
 47
47 -
 48
48 -
 49
49 -
 50
50 -
 51
51 -
 52
52 -
 53
53 -
 54
54 -
 55
55 -
 56
56 -
 57
57 -
 58
58 -
 59
59 -
 60
60 -
 61
61 -
 62
62 -
 63
63 -
 64
64 -
 65
65 -
 66
66 -
67
-
68
-
69
-
70
-
71
-
72
-
73
-
74
-
75
-
76
-
77
-
78
-
79
-
80
-
81
-
82
-
83
-
84
-
85
-
86
-
87
-
88
-
89
-
90
-
91
-
92
-
93
-
94
-
95
-
96
-
97
-
98
-
99
-
100
-
101
-
102
-
103
-
104
-
105
-
106
-
107
-
108
-
109
-
110
-
111
-
112
-
113
-
114
-
115
-
116
-
117
-
118
-
119
-
120
-
121
-
122
-
123
-
124
-
125
-
126
-
127
-
128
-
129
-
130
-
131
-
132
-
133
-
134
-
135
-
136
-
137
-
138
-
139
-
140
-
141
-
142
-
143
-
144
-
145
-
146
-
147
-
148
-
149
-
150
-
151
-
152
-
153
-
154
-
155
-
156
-
157
-
158
-
159
-
160
-
161
-
162
-
163
-
164
-
165
-
166
-
167
-
168
-
169
-
170
-
171
-
172
-
173
-
174
-
175
-
176
-
177
-
178
 |
 |

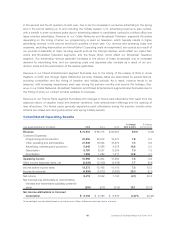
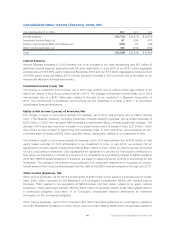
Year ended December 31 (in millions) 2015 2014 2013
% Change
2014 to 2015
% Change
2013 to 2014
Revenue
Cable Networks $ 9,628 $ 9,563 $ 9,201 0.7% 3.9%
Broadcast Television 8,530 8,542 7,120 (0.1) 20.0
Filmed Entertainment 7,287 5,008 5,452 45.5 (8.2)
Theme Parks 3,339 2,623 2,235 27.3 17.3
Headquarters, other and eliminations (322) (308) (358) NM NM
Total revenue $ 28,462 $ 25,428 $ 23,650 11.9% 7.5%
Operating Income Before Depreciation and
Amortization
Cable Networks $ 3,499 $ 3,589 $ 3,501 (2.5)% 2.5%
Broadcast Television 780 734 345 6.3 112.5
Filmed Entertainment 1,234 711 483 73.5 47.3
Theme Parks(a) 1,464 1,096 943 33.5 16.3
Headquarters, other and eliminations(a) (563) (542) (540) (3.8) (0.7)
Total operating income before depreciation
and amortization $ 6,414 $ 5,588 $ 4,732 14.8% 18.1%
Percentage changes that are considered not meaningful are denoted with NM.
(a) As disclosed in Note 11 to the Comcast consolidated financial statements, NBCUniversal changed its method of accounting for a con-
tractual obligation that involves an interest in the revenue of certain theme parks. As a result of the change, beginning in the fourth
quarter of 2015, amounts payable based on current period revenue are presented in operating costs and expenses. Amounts paid
through the third quarter of 2015 were included in other income (expense), net in our consolidated statement of income. For segment
reporting purposes, we have adjusted periods prior to the fourth quarter of 2015 to reflect this expense on a consistent basis for all peri-
ods in the Theme Parks segment, which resulted in an offsetting adjustment in NBCUniversal Headquarters, Other and Eliminations.
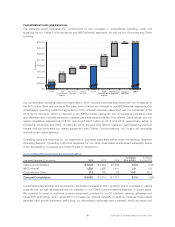
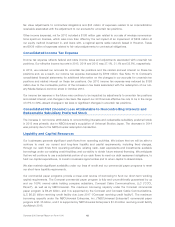
Cable Networks Segment Results of Operations
Year ended December 31 (in millions) 2015 2014 2013
% Change
2014 to 2015
% Change
2013 to 2014
Revenue
Distribution $ 5,461 $ 5,307 $ 4,905 2.9% 8.2%
Advertising 3,435 3,494 3,536 (1.7) (1.2)
Content licensing and other 732 762 760 (4.0) 0.3
Total revenue 9,628 9,563 9,201 0.7 3.9
Operating costs and expenses
Programming and production 4,319 4,241 3,850 1.8 10.2
Other operating and administrative 1,270 1,232 1,342 3.1 (8.3)
Advertising, marketing and promotion 540 501 508 7.7 (1.3)
Total operating costs and expenses 6,129 5,974 5,700 2.6 4.8
Operating income before depreciation and
amortization $ 3,499 $ 3,589 $ 3,501 (2.5)% 2.5%
Cable Networks Segment – Revenue
Distribution
Distribution revenue is generated from distribution agreements with multichannel video providers and is
affected by the number of subscribers receiving our cable networks and the fees we charge per subscriber.
Distribution revenue increased in 2015 primarily due to increases in the contractual rates charged under dis-
tribution agreements which were partially due to the premiere of NASCAR programming on the NBC Sports
53 Comcast 2015 Annual Report on Form 10-K