Comcast 2015 Annual Report Download - page 117
Download and view the complete annual report
Please find page 117 of the 2015 Comcast annual report below. You can navigate through the pages in the report by either clicking on the pages listed below, or by using the keyword search tool below to find specific information within the annual report.
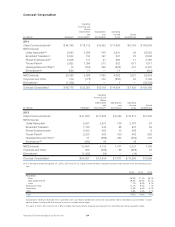
Comcast Corporation
(in millions) Revenue(g)
Operating
Income (Loss)
Before
Depreciation
and
Amortization(h)
Depreciation
and
Amortization
Operating
Income
(Loss)
Capital
Expenditures Assets
2014
Cable Communications(a) $ 44,140 $ 18,112 $ 6,422 $ 11,690 $ 6,154 $ 140,616
NBCUniversal
Cable Networks(b)(c) 9,563 3,589 748 2,841 49 28,582
Broadcast Television(c) 8,542 734 127 607 76 6,806
Filmed Entertainment(b) 5,008 711 21 690 11 4,185
Theme Parks(d) 2,623 1,096 273 823 671 7,017
Headquarters and Other(e) 13 (613) 326 (939) 414 6,467
Eliminations(d)(f) (321) 71 — 71 — (453)
NBCUniversal 25,428 5,588 1,495 4,093 1,221 52,604
Corporate and Other 709 (778) 102 (880) 45 5,198
Eliminations(f) (1,502) 1 — 1 — (39,232)
Comcast Consolidated $ 68,775 $ 22,923 $ 8,019 $ 14,904 $ 7,420 $ 159,186
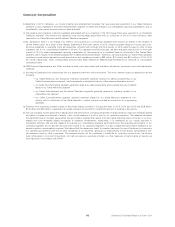
(in millions) Revenue(g)
Operating
Income (Loss)
Before
Depreciation
and
Amortization(h)
Depreciation
and
Amortization
Operating
Income
(Loss)
Capital
Expenditures
2013
Cable Communications(a) $ 41,836 $ 17,205 $ 6,394 $ 10,811 $ 5,403
NBCUniversal
Cable Networks(b) 9,201 3,501 734 2,767 67
Broadcast Television 7,120 345 98 247 65
Filmed Entertainment(b) 5,452 483 15 468 9
Theme Parks(d) 2,235 943 300 643 580
Headquarters and Other(e) 31 (588) 264 (852) 439
Eliminations(d)(f) (389) 48 — 48 —
NBCUniversal 23,650 4,732 1,411 3,321 1,160
Corporate and Other 600 (489) 66 (555) 33
Eliminations(f) (1,429) (14) — (14) —
Comcast Consolidated $ 64,657 $ 21,434 $ 7,871 $ 13,563 $ 6,596
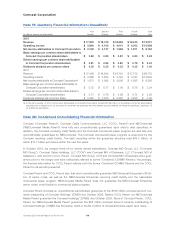
(a) For the years ended December 31, 2015, 2014 and 2013, Cable Communications segment revenue was derived from the following sour-
ces:
2015 2014 2013
Residential:
Video 45.9% 47.1% 49.1%
High-speed Internet 26.6% 25.6% 24.7%
Voice 7.7% 8.3% 8.7%
Business services 10.1% 9.0% 7.7%
Advertising 4.9% 5.4% 5.1%
Other 4.8% 4.6% 4.7%
Total 100% 100% 100%
Subscription revenue received from customers who purchase bundled services at a discounted rate is allocated proportionally to each
service based on the individual service’s price on a stand-alone basis.
For each of 2015, 2014 and 2013, 2.8% of Cable Communications revenue was derived from franchise and other regulatory fees.
Comcast 2015 Annual Report on Form 10-K 114


