Comcast 2015 Annual Report Download - page 52
Download and view the complete annual report
Please find page 52 of the 2015 Comcast annual report below. You can navigate through the pages in the report by either clicking on the pages listed below, or by using the keyword search tool below to find specific information within the annual report.-
 1
1 -
2
-
3
-
4
-
5
-
6
-
7
-
8
-
9
-
10
-
11
-
12
-
13
-
14
-
15
-
16
-
17
-
18
-
19
-
20
-
21
-
22
-
23
-
24
-
25
-
26
-
27
-
28
-
29
-
30
-
31
-
32
-
33
-
34
-
35
-
36
-
37
-
38
-
39
-
40
-
41
-
 42
42 -
 43
43 -
 44
44 -
 45
45 -
 46
46 -
 47
47 -
 48
48 -
 49
49 -
 50
50 -
 51
51 -
 52
52 -
 53
53 -
 54
54 -
 55
55 -
 56
56 -
 57
57 -
 58
58 -
 59
59 -
 60
60 -
 61
61 -
 62
62 -
63
-
64
-
65
-
66
-
67
-
68
-
69
-
70
-
71
-
72
-
73
-
74
-
75
-
76
-
77
-
78
-
79
-
80
-
81
-
82
-
83
-
84
-
85
-
86
-
87
-
88
-
89
-
90
-
91
-
92
-
93
-
94
-
95
-
96
-
97
-
98
-
99
-
100
-
101
-
102
-
103
-
104
-
105
-
106
-
107
-
108
-
109
-
110
-
111
-
112
-
113
-
114
-
115
-
116
-
117
-
118
-
119
-
120
-
121
-
122
-
123
-
124
-
125
-
126
-
127
-
128
-
129
-
130
-
131
-
132
-
133
-
134
-
135
-
136
-
137
-
138
-
139
-
140
-
141
-
142
-
143
-
144
-
145
-
146
-
147
-
148
-
149
-
150
-
151
-
152
-
153
-
154
-
155
-
156
-
157
-
158
-
159
-
160
-
161
-
162
-
163
-
164
-
165
-
166
-
167
-
168
-
169
-
170
-
171
-
172
-
173
-
174
-
175
-
176
-
177
-
178
 |
 |

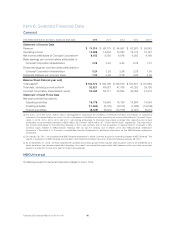
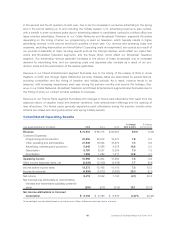
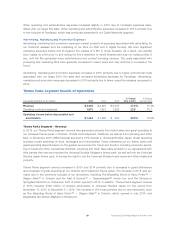
Year ended December 31 (in millions) 2015 2014 2013
% Change
2014 to 2015
% Change
2013 to 2014
Revenue
Residential:
Video $ 21,526 $ 20,783 $ 20,535 3.6% 1.2%
High-speed Internet 12,471 11,321 10,334 10.2 9.5
Voice 3,608 3,671 3,657 (1.7) 0.4
Business services 4,742 3,951 3,241 20.0 21.9
Advertising 2,318 2,393 2,147 (3.1) 11.5
Other 2,214 2,021 1,922 9.6 5.1
Total revenue 46,879 44,140 41,836 6.2 5.5
Operating costs and expenses
Programming 10,516 9,819 9,107 7.1 7.8
Technical and product support 5,904 5,547 5,373 6.4 3.2
Customer service 2,377 2,205 2,097 7.8 5.2
Franchise and other regulatory fees 1,382 1,296 1,246 6.7 4.0
Advertising, marketing and promotion 3,340 3,083 2,905 8.4 6.1
Other 4,240 4,078 3,903 3.9 4.5
Total operating costs and expenses 27,759 26,028 24,631 6.7 5.7
Operating income before depreciation and
amortization $ 19,120 $ 18,112 $ 17,205 5.6% 5.3%
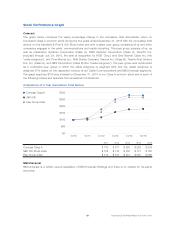
Customer Metrics
Total Customers Net Additional Customers
December 31 (in thousands) 2015 2014 2013 2015 2014 2013
Total customer relationships(a) 27,701 27,035 26,677 666 358 215
Single product customers(a) 8,366 8,409 8,752 (43) (343) (593)
Double product customers(a) 9,221 8,750 8,541 472 209 34
Triple product customers(a) 10,114 9,876 9,384 238 492 774
Video customers 22,347 22,383 22,577 (36) (194) (267)
High-speed Internet customers 23,329 21,962 20,685 1,367 1,277 1,296
Voice customers 11,475 11,193 10,723 282 470 768
Average monthly total revenue per customer
relationship $ 142.74 $ 136.97 $ 131.22
Customer metrics include residential and business customers and are presented based on actual amounts. Minor differences may exist due
to rounding.
(a) Customer relationships represent the number of residential and business customers that subscribe to at least one of our cable services.
Single product, double product and triple product customers represent customers that subscribe to one, two or three of our cable serv-
ices, respectively.
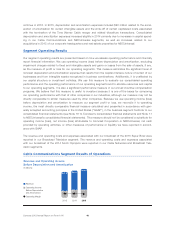
Cable Communications Segment – Revenue
Video
Video revenue increased 3.6% and 1.2% in 2015 and 2014, respectively. The increases in revenue in both
years were due to increases in the number of residential customers receiving additional and higher levels of
video service and rate adjustments, partially offset by decreases in the number of residential video customers.
The increases in residential customers receiving additional and higher levels of video service and rate adjust-
ments accounted for increases in revenue of 4.5% and 2.7% in 2015 and 2014, respectively. As of
December 31, 2015, 13.9 million customers subscribed to at least one of our HD or DVR advanced services
compared to 13.0 million customers and 12.5 million customers as of December 31, 2014 and 2013,
49 Comcast 2015 Annual Report on Form 10-K