Comcast 2015 Annual Report Download - page 113
Download and view the complete annual report
Please find page 113 of the 2015 Comcast annual report below. You can navigate through the pages in the report by either clicking on the pages listed below, or by using the keyword search tool below to find specific information within the annual report.-
 1
1 -
2
-
3
-
4
-
5
-
6
-
7
-
8
-
9
-
10
-
11
-
12
-
13
-
14
-
15
-
16
-
17
-
18
-
19
-
20
-
21
-
22
-
23
-
24
-
25
-
26
-
27
-
28
-
29
-
30
-
31
-
32
-
33
-
34
-
35
-
36
-
37
-
38
-
39
-
40
-
41
-
42
-
43
-
44
-
45
-
46
-
47
-
48
-
49
-
50
-
51
-
52
-
53
-
54
-
55
-
56
-
57
-
58
-
59
-
60
-
61
-
62
-
63
-
64
-
65
-
66
-
67
-
68
-
69
-
70
-
71
-
72
-
73
-
74
-
75
-
76
-
77
-
78
-
79
-
80
-
81
-
82
-
83
-
84
-
85
-
86
-
87
-
88
-
89
-
90
-
91
-
92
-
93
-
94
-
95
-
96
-
97
-
98
-
99
-
100
-
101
-
102
-
 103
103 -
 104
104 -
 105
105 -
 106
106 -
 107
107 -
 108
108 -
 109
109 -
 110
110 -
 111
111 -
 112
112 -
 113
113 -
 114
114 -
 115
115 -
 116
116 -
 117
117 -
 118
118 -
 119
119 -
 120
120 -
 121
121 -
 122
122 -
 123
123 -
124
-
125
-
126
-
127
-
128
-
129
-
130
-
131
-
132
-
133
-
134
-
135
-
136
-
137
-
138
-
139
-
140
-
141
-
142
-
143
-
144
-
145
-
146
-
147
-
148
-
149
-
150
-
151
-
152
-
153
-
154
-
155
-
156
-
157
-
158
-
159
-
160
-
161
-
162
-
163
-
164
-
165
-
166
-
167
-
168
-
169
-
170
-
171
-
172
-
173
-
174
-
175
-
176
-
177
-
178
 |
 |

Comcast Corporation
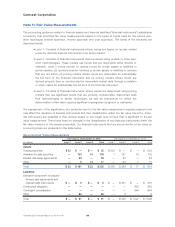
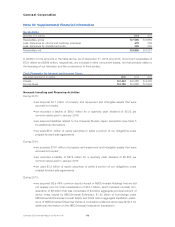
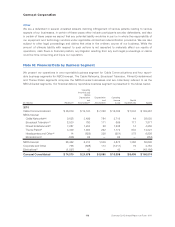
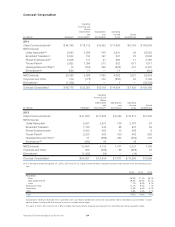
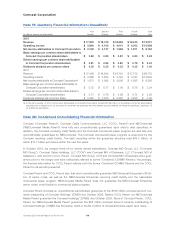
Note 16: Supplemental Financial Information
Receivables
December 31 (in millions) 2015 2014
Receivables, gross $ 7,595 $ 6,885
Less: Allowance for returns and customer incentives 473 359
Less: Allowance for doubtful accounts 226 205
Receivables, net $ 6,896 $ 6,321
In addition to the amounts in the table above, as of December 31, 2015 and 2014, noncurrent receivables of
$721 million and $569 million, respectively, are included in other noncurrent assets, net that primarily relate to
the licensing of our television and film productions to third parties.
Cash Payments for Interest and Income Taxes
Year ended December 31 (in millions) 2015 2014 2013
Interest $ 2,443 $ 2,389 $ 2,355
Income taxes $ 3,726 $ 3,668 $ 3,946
Noncash Investing and Financing Activities
During 2015:
• we acquired $1.1 billion of property and equipment and intangible assets that were
accrued but unpaid
• we recorded a liability of $612 million for a quarterly cash dividend of $0.25 per
common share paid in January 2016
• we assumed liabilities related to the Universal Studios Japan transaction (see Note 5
for additional information)
• we used $517 million of equity securities to settle a portion of our obligations under
prepaid forward sale agreements
During 2014:
• we acquired $797 million of property and equipment and intangible assets that were
accrued but unpaid
• we recorded a liability of $572 million for a quarterly cash dividend of $0.225 per
common share paid in January 2015
• we used $3.2 billion of equity securities to settle a portion of our obligations under
prepaid forward sale agreements
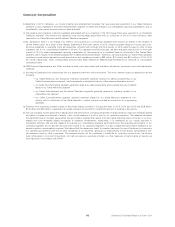
During 2013:
• we acquired GE’s 49% common equity interest in NBCUniversal Holdings that we did
not already own for total consideration of $16.7 billion, which included noncash con-
sideration of $6 billion that was comprised of $4 billion aggregate principal amount of
senior notes issued by NBCUniversal Enterprise, $1.25 billion of borrowings under
NBCUniversal Enterprise’s credit facility and $725 million aggregate liquidation prefer-
ence of NBCUniversal Enterprise Series A cumulative preferred stock (see Note 5 for
additional information on the NBCUniversal redemption transaction)
Comcast 2015 Annual Report on Form 10-K 110