Comcast 2015 Annual Report Download - page 79
Download and view the complete annual report
Please find page 79 of the 2015 Comcast annual report below. You can navigate through the pages in the report by either clicking on the pages listed below, or by using the keyword search tool below to find specific information within the annual report.-
 1
1 -
2
-
3
-
4
-
5
-
6
-
7
-
8
-
9
-
10
-
11
-
12
-
13
-
14
-
15
-
16
-
17
-
18
-
19
-
20
-
21
-
22
-
23
-
24
-
25
-
26
-
27
-
28
-
29
-
30
-
31
-
32
-
33
-
34
-
35
-
36
-
37
-
38
-
39
-
40
-
41
-
42
-
43
-
44
-
45
-
46
-
47
-
48
-
49
-
50
-
51
-
52
-
53
-
54
-
55
-
56
-
57
-
58
-
59
-
60
-
61
-
62
-
63
-
64
-
65
-
66
-
67
-
68
-
 69
69 -
 70
70 -
 71
71 -
 72
72 -
 73
73 -
 74
74 -
 75
75 -
 76
76 -
 77
77 -
 78
78 -
 79
79 -
 80
80 -
 81
81 -
 82
82 -
 83
83 -
 84
84 -
 85
85 -
 86
86 -
 87
87 -
 88
88 -
 89
89 -
90
-
91
-
92
-
93
-
94
-
95
-
96
-
97
-
98
-
99
-
100
-
101
-
102
-
103
-
104
-
105
-
106
-
107
-
108
-
109
-
110
-
111
-
112
-
113
-
114
-
115
-
116
-
117
-
118
-
119
-
120
-
121
-
122
-
123
-
124
-
125
-
126
-
127
-
128
-
129
-
130
-
131
-
132
-
133
-
134
-
135
-
136
-
137
-
138
-
139
-
140
-
141
-
142
-
143
-
144
-
145
-
146
-
147
-
148
-
149
-
150
-
151
-
152
-
153
-
154
-
155
-
156
-
157
-
158
-
159
-
160
-
161
-
162
-
163
-
164
-
165
-
166
-
167
-
168
-
169
-
170
-
171
-
172
-
173
-
174
-
175
-
176
-
177
-
178
 |
 |

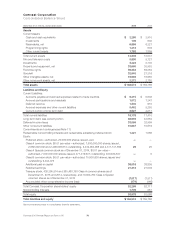
Comcast Corporation
Consolidated Balance Sheet
December 31 (in millions, except share data) 2015 2014
Assets
Current Assets:
Cash and cash equivalents $ 2,295 $ 3,910
Investments 106 602
Receivables, net 6,896 6,321
Programming rights 1,213 839
Other current assets 1,793 1,859
Total current assets 12,303 13,531
Film and television costs 5,855 5,727
Investments 3,224 3,135
Property and equipment, net 33,665 30,953
Franchise rights 59,364 59,364
Goodwill 32,945 27,316
Other intangible assets, net 16,946 16,980
Other noncurrent assets, net 2,272 2,180
Total assets $ 166,574 $ 159,186
Liabilities and Equity
Current Liabilities:
Accounts payable and accrued expenses related to trade creditors $ 6,215 $ 5,638
Accrued participations and residuals 1,572 1,347
Deferred revenue 1,302 915
Accrued expenses and other current liabilities 5,462 5,293
Current portion of long-term debt 3,627 4,217
Total current liabilities 18,178 17,410
Long-term debt, less current portion 48,994 43,864
Deferred income taxes 33,566 32,959
Other noncurrent liabilities 10,637 10,819
Commitments and contingencies (Note 17)
Redeemable noncontrolling interests and redeemable subsidiary preferred stock 1,221 1,066
Equity:
Preferred stock—authorized, 20,000,000 shares; issued, zero ——
Class A common stock, $0.01 par value—authorized, 7,500,000,000 shares; issued,
2,869,349,502 and 2,496,598,612; outstanding, 2,432,953,988 and 2,131,137,862 29 25
Class A Special common stock as of December 31, 2014, $0.01 par value—
authorized, 7,500,000,000 shares; issued, 471,419,601; outstanding, 400,484,837 —5
Class B common stock, $0.01 par value—authorized, 75,000,000 shares; issued and
outstanding, 9,444,375 ——
Additional paid-in capital 38,518 38,805
Retained earnings 21,413 21,539
Treasury stock, 436,395,514 and 365,460,750 Class A common shares as of
December 31, 2015 and 2014, respectively, and 70,934,764 Class A Special
common shares as of December 31, 2014 (7,517) (7,517)
Accumulated other comprehensive income (loss) (174) (146)
Total Comcast Corporation shareholders’ equity 52,269 52,711
Noncontrolling interests 1,709 357
Total equity 53,978 53,068
Total liabilities and equity $ 166,574 $ 159,186
See accompanying notes to consolidated financial statements.
Comcast 2015 Annual Report on Form 10-K 76