Comcast 2015 Annual Report Download - page 124
Download and view the complete annual report
Please find page 124 of the 2015 Comcast annual report below. You can navigate through the pages in the report by either clicking on the pages listed below, or by using the keyword search tool below to find specific information within the annual report.-
 1
1 -
2
-
3
-
4
-
5
-
6
-
7
-
8
-
9
-
10
-
11
-
12
-
13
-
14
-
15
-
16
-
17
-
18
-
19
-
20
-
21
-
22
-
23
-
24
-
25
-
26
-
27
-
28
-
29
-
30
-
31
-
32
-
33
-
34
-
35
-
36
-
37
-
38
-
39
-
40
-
41
-
42
-
43
-
44
-
45
-
46
-
47
-
48
-
49
-
50
-
51
-
52
-
53
-
54
-
55
-
56
-
57
-
58
-
59
-
60
-
61
-
62
-
63
-
64
-
65
-
66
-
67
-
68
-
69
-
70
-
71
-
72
-
73
-
74
-
75
-
76
-
77
-
78
-
79
-
80
-
81
-
82
-
83
-
84
-
85
-
86
-
87
-
88
-
89
-
90
-
91
-
92
-
93
-
94
-
95
-
96
-
97
-
98
-
99
-
100
-
101
-
102
-
103
-
104
-
105
-
106
-
107
-
108
-
109
-
110
-
111
-
112
-
113
-
 114
114 -
 115
115 -
 116
116 -
 117
117 -
 118
118 -
 119
119 -
 120
120 -
 121
121 -
 122
122 -
 123
123 -
 124
124 -
 125
125 -
 126
126 -
 127
127 -
 128
128 -
 129
129 -
 130
130 -
 131
131 -
 132
132 -
 133
133 -
 134
134 -
135
-
136
-
137
-
138
-
139
-
140
-
141
-
142
-
143
-
144
-
145
-
146
-
147
-
148
-
149
-
150
-
151
-
152
-
153
-
154
-
155
-
156
-
157
-
158
-
159
-
160
-
161
-
162
-
163
-
164
-
165
-
166
-
167
-
168
-
169
-
170
-
171
-
172
-
173
-
174
-
175
-
176
-
177
-
178
 |
 |

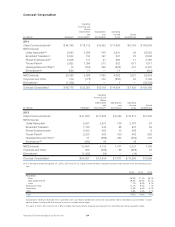
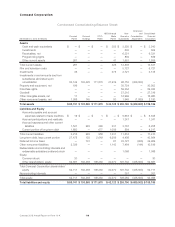
Comcast Corporation
Condensed Consolidating Statement of Income
For the Year Ended December 31, 2013 (in millions)
Comcast
Parent
Comcast
Holdings
CCCL
Parent
NBCUniversal
Media
Parent
Non-
Guarantor
Subsidiaries
Elimination
and
Consolidation
Adjustments
Consolidated
Comcast
Corporation
Revenue:
Service revenue $ — $ — $ — $ — $ 64,657 $ — $ 64,657
Management fee revenue 897 — 874 — — (1,771) —
897 — 874 — 64,657 (1,771) 64,657
Costs and Expenses:
Programming and production — — — — 19,670 — 19,670
Other operating and administrative 403 — 874 855 18,214 (1,771) 18,575
Advertising, marketing and promotion — — — — 4,978 — 4,978
Depreciation 30 — — — 6,224 — 6,254
Amortization 5 — — — 1,612 — 1,617
438 — 874 855 50,698 (1,771) 51,094
Operating income (loss) 459 — — (855) 13,959 — 13,563
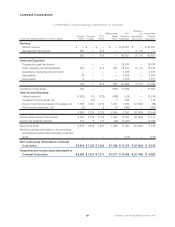
Other Income (Expense):
Interest expense (1,523) (11) (338) (488) (214) — (2,574)
Investment income (loss), net — (13) — 3 586 — 576
Equity in net income (losses) of investees, net 7,509 7,540 7,512 3,331 1,882 (27,860) (86)
Other income (expense), net (2) — 2 (1) (363) — (364)
5,984 7,516 7,176 2,845 1,891 (27,860) (2,448)
Income (loss) before income taxes 6,443 7,516 7,176 1,990 15,850 (27,860) 11,115
Income tax (expense) benefit 373 9 117 (22) (4,457) — (3,980)
Net income (loss) 6,816 7,525 7,293 1,968 11,393 (27,860) 7,135
Net (income) loss attributable to noncontrolling
interests and redeemable subsidiary preferred
stock — — — — (319) — (319)
Net income (loss) attributable to Comcast
Corporation $ 6,816 $ 7,525 $ 7,293 $ 1,968 $ 11,074 $ (27,860) $ 6,816
Comprehensive income (loss) attributable to
Comcast Corporation $ 6,883 $ 7,521 $ 7,277 $ 2,017 $ 10,969 $ (27,784) $ 6,883
121 Comcast 2015 Annual Report on Form 10-K