Comcast 2015 Annual Report Download - page 172
Download and view the complete annual report
Please find page 172 of the 2015 Comcast annual report below. You can navigate through the pages in the report by either clicking on the pages listed below, or by using the keyword search tool below to find specific information within the annual report.-
 1
1 -
2
-
3
-
4
-
5
-
6
-
7
-
8
-
9
-
10
-
11
-
12
-
13
-
14
-
15
-
16
-
17
-
18
-
19
-
20
-
21
-
22
-
23
-
24
-
25
-
26
-
27
-
28
-
29
-
30
-
31
-
32
-
33
-
34
-
35
-
36
-
37
-
38
-
39
-
40
-
41
-
42
-
43
-
44
-
45
-
46
-
47
-
48
-
49
-
50
-
51
-
52
-
53
-
54
-
55
-
56
-
57
-
58
-
59
-
60
-
61
-
62
-
63
-
64
-
65
-
66
-
67
-
68
-
69
-
70
-
71
-
72
-
73
-
74
-
75
-
76
-
77
-
78
-
79
-
80
-
81
-
82
-
83
-
84
-
85
-
86
-
87
-
88
-
89
-
90
-
91
-
92
-
93
-
94
-
95
-
96
-
97
-
98
-
99
-
100
-
101
-
102
-
103
-
104
-
105
-
106
-
107
-
108
-
109
-
110
-
111
-
112
-
113
-
114
-
115
-
116
-
117
-
118
-
119
-
120
-
121
-
122
-
123
-
124
-
125
-
126
-
127
-
128
-
129
-
130
-
131
-
132
-
133
-
134
-
135
-
136
-
137
-
138
-
139
-
140
-
141
-
142
-
143
-
144
-
145
-
146
-
147
-
148
-
149
-
150
-
151
-
152
-
153
-
154
-
155
-
156
-
157
-
158
-
159
-
160
-
161
-
 162
162 -
 163
163 -
 164
164 -
 165
165 -
 166
166 -
 167
167 -
 168
168 -
 169
169 -
 170
170 -
 171
171 -
 172
172 -
 173
173 -
 174
174 -
 175
175 -
 176
176 -
 177
177 -
 178
178
 |
 |

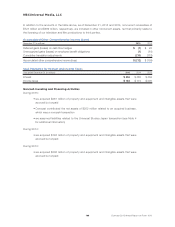
NBCUniversal Media, LLC
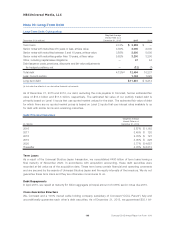
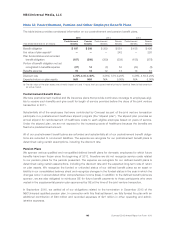
In addition to the amounts in the table above, as of December 31, 2015 and 2014, noncurrent receivables of
$721 million and $569 million, respectively, are included in other noncurrent assets, net that primarily relate to
the licensing of our television and film productions to third parties.
Accumulated Other Comprehensive Income (Loss)
December 31 (in millions) 2015 2014
Deferred gains (losses) on cash flow hedges $ (1) $20
Unrecognized gains (losses) on employee benefit obligations (1) (61)
Cumulative translation adjustments (210) (118)
Accumulated other comprehensive income (loss) $ (212) $ (159)
Cash Payments for Interest and Income Taxes
Year ended December 31 (in millions) 2015 2014 2013
Interest $ 456 $ 485 $ 462
Income taxes $ 182 $ 174 $ 205
Noncash Investing and Financing Activities
During 2015:
• we acquired $287 million of property and equipment and intangible assets that were
accrued but unpaid
• Comcast contributed the net assets of $252 million related to an acquired business,
which was a noncash transaction
• we assumed liabilities related to the Universal Studios Japan transaction (see Note 4
for additional information)
During 2014:
• we acquired $148 million of property and equipment and intangible assets that were
accrued but unpaid
During 2013:
• we acquired $306 million of property and equipment and intangible assets that were
accrued but unpaid
169 Comcast 2015 Annual Report on Form 10-K