Comcast 2015 Annual Report Download - page 54
Download and view the complete annual report
Please find page 54 of the 2015 Comcast annual report below. You can navigate through the pages in the report by either clicking on the pages listed below, or by using the keyword search tool below to find specific information within the annual report.-
 1
1 -
2
-
3
-
4
-
5
-
6
-
7
-
8
-
9
-
10
-
11
-
12
-
13
-
14
-
15
-
16
-
17
-
18
-
19
-
20
-
21
-
22
-
23
-
24
-
25
-
26
-
27
-
28
-
29
-
30
-
31
-
32
-
33
-
34
-
35
-
36
-
37
-
38
-
39
-
40
-
41
-
42
-
43
-
 44
44 -
 45
45 -
 46
46 -
 47
47 -
 48
48 -
 49
49 -
 50
50 -
 51
51 -
 52
52 -
 53
53 -
 54
54 -
 55
55 -
 56
56 -
 57
57 -
 58
58 -
 59
59 -
 60
60 -
 61
61 -
 62
62 -
 63
63 -
 64
64 -
65
-
66
-
67
-
68
-
69
-
70
-
71
-
72
-
73
-
74
-
75
-
76
-
77
-
78
-
79
-
80
-
81
-
82
-
83
-
84
-
85
-
86
-
87
-
88
-
89
-
90
-
91
-
92
-
93
-
94
-
95
-
96
-
97
-
98
-
99
-
100
-
101
-
102
-
103
-
104
-
105
-
106
-
107
-
108
-
109
-
110
-
111
-
112
-
113
-
114
-
115
-
116
-
117
-
118
-
119
-
120
-
121
-
122
-
123
-
124
-
125
-
126
-
127
-
128
-
129
-
130
-
131
-
132
-
133
-
134
-
135
-
136
-
137
-
138
-
139
-
140
-
141
-
142
-
143
-
144
-
145
-
146
-
147
-
148
-
149
-
150
-
151
-
152
-
153
-
154
-
155
-
156
-
157
-
158
-
159
-
160
-
161
-
162
-
163
-
164
-
165
-
166
-
167
-
168
-
169
-
170
-
171
-
172
-
173
-
174
-
175
-
176
-
177
-
178
 |
 |
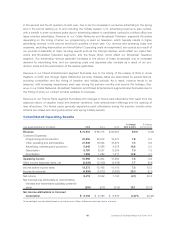
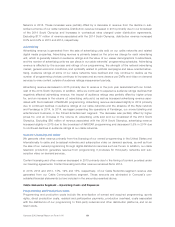
revenue increased 11.5% in 2014 primarily due to an increase in political revenue of 8.0%, as well as an
increase in revenue in our national and local advertising markets. Excluding the impact of political advertising
revenue, advertising revenue increased 3.5% in 2014.
In 2015, 7% of our Cable Communications segment’s advertising revenue was generated from our NBCUni-
versal segments, compared to 5% and 4% in 2014 and 2013, respectively. These amounts are eliminated in
our consolidated financial statements but are included in the amounts presented above.
Other
Other revenue primarily includes revenue related to cable franchise and other regulatory fees. We also receive
revenue related to fees from other services, such as our home security and automation services. Cable fran-
chise and other regulatory fees represent the fees we are required to pay to federal, state and local
authorities that we pass through to our customers. Under the terms of our cable franchise agreements, we
are generally required to pay to the cable franchising authority an amount based on our gross video revenue.
The changes in franchise and other regulatory fees collected from our cable services customers are generally
due to changes in the revenue on which the fees apply.
Other revenue increased 9.6% and 5.1% in 2015 and 2014, respectively, primarily due to increases in rev-
enue from our home security and automation services, as well as increases in cable franchise and other
regulatory fees.
Cable Communications Segment – Operating Costs and Expenses
Our operating margin, which is our operating income before depreciation and amortization as a percentage of
revenue, for 2015, 2014 and 2013 was 40.8%, 41.0% and 41.1%, respectively.
Programming Expenses
Programming expenses, which represent our most significant operating expense, are the fees we incur to
provide content to our video customers. These expenses are affected by the programming license fees
charged by cable networks, the fees charged for retransmission of the signals from local broadcast television
stations, the number of video customers we serve and the amount of content we provide. Programming
expenses increased in 2015 and 2014 primarily due to increases in programming license fees, including
sports programming costs and retransmission consent fees, and fees to secure rights for additional
programming for our customers across an increasing number of platforms.
We anticipate that our programming expenses will continue to increase as we provide additional content to
our video customers; as we deliver this content through an increasing number of platforms, including On
Demand, online and through our mobile apps; and as the fees we pay increase, primarily sports programming
costs and retransmission consent fees. We believe that adding more content and delivering it on various plat-
forms will help us to attract and retain video customers.
Technical and Product Support Expenses
Technical and product support expenses include costs to complete service call and installation activities, as
well as costs for network operations, product development, fulfillment and provisioning. Technical and prod-
uct support expenses increased in 2015 and 2014 primarily due to expenses related to the development,
delivery and support of our enhanced devices, including our X1 set-top boxes, Cloud DVR technology and
wireless gateways, and the continued growth in business services and home security and automation serv-
ices. The increase in 2015 was also due to expenses related to investments we are making to improve the
customer experience.
51 Comcast 2015 Annual Report on Form 10-K