Comcast 2015 Annual Report Download - page 152
Download and view the complete annual report
Please find page 152 of the 2015 Comcast annual report below. You can navigate through the pages in the report by either clicking on the pages listed below, or by using the keyword search tool below to find specific information within the annual report.-
 1
1 -
2
-
3
-
4
-
5
-
6
-
7
-
8
-
9
-
10
-
11
-
12
-
13
-
14
-
15
-
16
-
17
-
18
-
19
-
20
-
21
-
22
-
23
-
24
-
25
-
26
-
27
-
28
-
29
-
30
-
31
-
32
-
33
-
34
-
35
-
36
-
37
-
38
-
39
-
40
-
41
-
42
-
43
-
44
-
45
-
46
-
47
-
48
-
49
-
50
-
51
-
52
-
53
-
54
-
55
-
56
-
57
-
58
-
59
-
60
-
61
-
62
-
63
-
64
-
65
-
66
-
67
-
68
-
69
-
70
-
71
-
72
-
73
-
74
-
75
-
76
-
77
-
78
-
79
-
80
-
81
-
82
-
83
-
84
-
85
-
86
-
87
-
88
-
89
-
90
-
91
-
92
-
93
-
94
-
95
-
96
-
97
-
98
-
99
-
100
-
101
-
102
-
103
-
104
-
105
-
106
-
107
-
108
-
109
-
110
-
111
-
112
-
113
-
114
-
115
-
116
-
117
-
118
-
119
-
120
-
121
-
122
-
123
-
124
-
125
-
126
-
127
-
128
-
129
-
130
-
131
-
132
-
133
-
134
-
135
-
136
-
137
-
138
-
139
-
140
-
141
-
 142
142 -
 143
143 -
 144
144 -
 145
145 -
 146
146 -
 147
147 -
 148
148 -
 149
149 -
 150
150 -
 151
151 -
 152
152 -
 153
153 -
 154
154 -
 155
155 -
 156
156 -
 157
157 -
 158
158 -
 159
159 -
 160
160 -
 161
161 -
 162
162 -
163
-
164
-
165
-
166
-
167
-
168
-
169
-
170
-
171
-
172
-
173
-
174
-
175
-
176
-
177
-
178
 |
 |

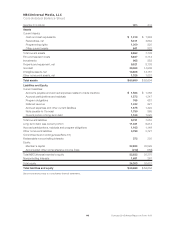
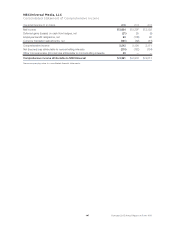
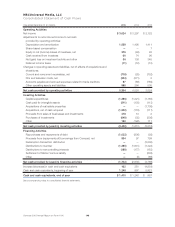
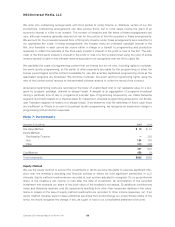
NBCUniversal Media, LLC
Consolidated Statement of Changes in Equity
(in millions)
Redeemable
Noncontrolling
Interests
Member’s
Capital
Accumulated
Other
Comprehensive
Income (Loss)
Non-
controlling
Interests
Total
Equity
Balance, December 31, 2012 $ 131 $ 31,900 $ (65) $ 419 $ 32,254
Compensation plans 7 7
Redemption transaction distribution (3,200) (3,200)
Dividends declared (1,422) (1,422)
Purchase of subsidiary shares from noncontrolling interests (33) (33)
Contributions from (distributions to) noncontrolling
interests, net (22) (155) (155)
Other 102 (164) (111) (275)
Other comprehensive income (loss) 49 49
Net income (loss) 20 1,968 134 2,102
Balance, December 31, 2013 231 29,056 (16) 287 29,327
Dividends declared (1,641) (1,641)
Issuance of subsidiary shares to noncontrolling interests 85
Contributions from (distributions to) noncontrolling
interests, net (24) (152) (152)
Other (1) (12) (13)
Other comprehensive income (loss) (143) (143)
Net income (loss) 38 3,115 144 3,259
Balance, December 31, 2014 330 30,529 (159) 267 30,637
Dividends declared (1,385) (1,385)
Contributions from (distributions to) noncontrolling
interests, net (30) (159) (159)
Contribution from member 252 252
Other comprehensive income (loss) (53) (29) (82)
Universal Studios Japan (11) 1,440 1,429
Other 28 35 (4) 31
Net income (loss) 44 3,414 166 3,580
Balance, December 31, 2015 $ 372 $ 32,834 $ (212) $ 1,681 $ 34,303
See accompanying notes to consolidated financial statements.
149 Comcast 2015 Annual Report on Form 10-K