Comcast 2015 Annual Report Download - page 66
Download and view the complete annual report
Please find page 66 of the 2015 Comcast annual report below. You can navigate through the pages in the report by either clicking on the pages listed below, or by using the keyword search tool below to find specific information within the annual report.-
 1
1 -
2
-
3
-
4
-
5
-
6
-
7
-
8
-
9
-
10
-
11
-
12
-
13
-
14
-
15
-
16
-
17
-
18
-
19
-
20
-
21
-
22
-
23
-
24
-
25
-
26
-
27
-
28
-
29
-
30
-
31
-
32
-
33
-
34
-
35
-
36
-
37
-
38
-
39
-
40
-
41
-
42
-
43
-
44
-
45
-
46
-
47
-
48
-
49
-
50
-
51
-
52
-
53
-
54
-
55
-
 56
56 -
 57
57 -
 58
58 -
 59
59 -
 60
60 -
 61
61 -
 62
62 -
 63
63 -
 64
64 -
 65
65 -
 66
66 -
 67
67 -
 68
68 -
 69
69 -
 70
70 -
 71
71 -
 72
72 -
 73
73 -
 74
74 -
 75
75 -
 76
76 -
77
-
78
-
79
-
80
-
81
-
82
-
83
-
84
-
85
-
86
-
87
-
88
-
89
-
90
-
91
-
92
-
93
-
94
-
95
-
96
-
97
-
98
-
99
-
100
-
101
-
102
-
103
-
104
-
105
-
106
-
107
-
108
-
109
-
110
-
111
-
112
-
113
-
114
-
115
-
116
-
117
-
118
-
119
-
120
-
121
-
122
-
123
-
124
-
125
-
126
-
127
-
128
-
129
-
130
-
131
-
132
-
133
-
134
-
135
-
136
-
137
-
138
-
139
-
140
-
141
-
142
-
143
-
144
-
145
-
146
-
147
-
148
-
149
-
150
-
151
-
152
-
153
-
154
-
155
-
156
-
157
-
158
-
159
-
160
-
161
-
162
-
163
-
164
-
165
-
166
-
167
-
168
-
169
-
170
-
171
-
172
-
173
-
174
-
175
-
176
-
177
-
178
 |
 |

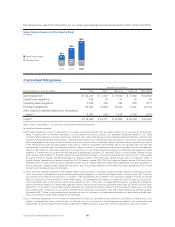
As of December 31, 2015, amounts available under our consolidated revolving credit facilities, net of amounts
outstanding under our commercial paper programs and outstanding letters of credit, totaled $6.4 billion,
which included $775 million available under the NBCUniversal Enterprise revolving credit facility.
We, NBCUniversal and CCCL Parent are subject to the covenants and restrictions set forth in the indentures
governing our public debt securities and in the credit agreements governing the Comcast revolving credit
facility. The only financial covenant is in this credit facility and pertains to leverage, which is the ratio of debt
to operating income before depreciation and amortization, as defined in the credit facility. We test for com-
pliance with the financial covenant for this credit facility on an ongoing basis. As of December 31, 2015, we
met this financial covenant by a significant margin. We do not expect to have to reduce debt or improve
operating results in order to continue to comply with this financial covenant. In addition, as a result of the
acquisition of Universal Studios Japan, we consolidated approximately ¥400 billion (approximately $3.3 billion
as of December 31, 2015) in term loans that contain certain financial covenants. As of December 31, 2015,
Universal Studios Japan was in compliance with all of these covenants.
In 2015, we entered into an agreement to establish Atairos Group, Inc., a new, strategic company focused on
investing in and operating growth-oriented companies, both domestically and internationally. The agreement
became effective as of January 1, 2016 and Michael J. Angelakis, who served as our Chief Financial Officer
through June 30, 2015, now serves as the Chairman and Chief Executive Officer of Atairos. Under the
agreement, we are the exclusive non-management investor. Atairos has a term of up to 12 years. We are
committed to invest up to $4 billion at any one time in the company, subject to certain offsets, and $40 mil-
lion annually to fund a management fee, subject to certain adjustments. We will account for our investment in
this company under the equity method of accounting.
Operating Activities
Components of Net Cash Provided by Operating Activities
Year ended December 31 (in millions) 2015 2014 2013
Operating income $ 15,998 $ 14,904 $ 13,563
Depreciation and amortization 8,680 8,019 7,871
Operating income before depreciation and amortization 24,678 22,923 21,434
Noncash share-based compensation 567 513 419
Termination of receivables monetization programs —— (1,442)
Changes in operating assets and liabilities (267) (357) 93
Cash basis operating income 24,978 23,079 20,504
Payments of interest (2,443) (2,389) (2,355)
Payments of income taxes (3,726) (3,668) (3,946)
Proceeds from investments and other 251 190 162
Excess tax benefits under share-based compensation (282) (267) (205)
Net cash provided by operating activities $ 18,778 $ 16,945 $ 14,160
The changes in operating assets and liabilities in 2015 compared to the changes in 2014 were primarily
related to the timing of film and television production spending and related costs, net of amortization, the
timing of payments related to our accounts payable and accrued expenses related to trade creditors and
increases in deferred revenue associated with our Olympics broadcasts, partially offset by the timing of collec-
tions on our receivables.
The changes in operating assets and liabilities in 2014 compared to the changes in 2013 were primarily due
to the timing of film and television production spending and related costs, net of amortization of approx-
imately $600 million.
63 Comcast 2015 Annual Report on Form 10-K