Comcast 2015 Annual Report Download - page 48
Download and view the complete annual report
Please find page 48 of the 2015 Comcast annual report below. You can navigate through the pages in the report by either clicking on the pages listed below, or by using the keyword search tool below to find specific information within the annual report.-
 1
1 -
2
-
3
-
4
-
5
-
6
-
7
-
8
-
9
-
10
-
11
-
12
-
13
-
14
-
15
-
16
-
17
-
18
-
19
-
20
-
21
-
22
-
23
-
24
-
25
-
26
-
27
-
28
-
29
-
30
-
31
-
32
-
33
-
34
-
35
-
36
-
37
-
 38
38 -
 39
39 -
 40
40 -
 41
41 -
 42
42 -
 43
43 -
 44
44 -
 45
45 -
 46
46 -
 47
47 -
 48
48 -
 49
49 -
 50
50 -
 51
51 -
 52
52 -
 53
53 -
 54
54 -
 55
55 -
 56
56 -
 57
57 -
 58
58 -
59
-
60
-
61
-
62
-
63
-
64
-
65
-
66
-
67
-
68
-
69
-
70
-
71
-
72
-
73
-
74
-
75
-
76
-
77
-
78
-
79
-
80
-
81
-
82
-
83
-
84
-
85
-
86
-
87
-
88
-
89
-
90
-
91
-
92
-
93
-
94
-
95
-
96
-
97
-
98
-
99
-
100
-
101
-
102
-
103
-
104
-
105
-
106
-
107
-
108
-
109
-
110
-
111
-
112
-
113
-
114
-
115
-
116
-
117
-
118
-
119
-
120
-
121
-
122
-
123
-
124
-
125
-
126
-
127
-
128
-
129
-
130
-
131
-
132
-
133
-
134
-
135
-
136
-
137
-
138
-
139
-
140
-
141
-
142
-
143
-
144
-
145
-
146
-
147
-
148
-
149
-
150
-
151
-
152
-
153
-
154
-
155
-
156
-
157
-
158
-
159
-
160
-
161
-
162
-
163
-
164
-
165
-
166
-
167
-
168
-
169
-
170
-
171
-
172
-
173
-
174
-
175
-
176
-
177
-
178
 |
 |

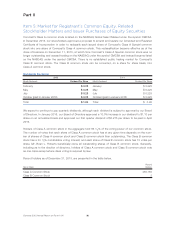
in the second and fourth quarters of each year, due in part to increases in consumer advertising in the spring
and in the period leading up to and including the holiday season. U.S. advertising revenue is also cyclical,
with a benefit in even-numbered years due to advertising related to candidates running for political office and
issue-oriented advertising. Revenue in our Cable Networks and Broadcast Television segments fluctuates
depending on the timing of when our programming is aired on television, which typically results in higher
advertising revenue in the second and fourth quarters of each year. Our revenue and operating costs and
expenses, excluding depreciation and amortization (“operating costs and expenses”) are cyclical as a result of
our periodic broadcasts of major sporting events such as the Olympic Games, which affect our Cable Net-
works and Broadcast Television segments, and the Super Bowl, which affect our Broadcast Television
segment. Our advertising revenue generally increases in the period of these broadcasts due to increased
demand for advertising time, and our operating costs and expenses also increase as a result of our pro-
duction costs and the amortization of the related rights fees.
Revenue in our Filmed Entertainment segment fluctuates due to the timing of the release of films in movie
theaters, on DVD and through digital distribution services. Release dates are determined by several factors,
including competition and the timing of vacation and holiday periods. As a result, revenue tends to be
seasonal, with increases experienced each year during the summer months and around the holidays. Rev-
enue in our Cable Networks, Broadcast Television and Filmed Entertainment segments also fluctuates due to
the timing of when our content is made available to licensees.
Revenue in our Theme Parks segment fluctuates with changes in theme park attendance that result from the
seasonal nature of vacation travel and weather variations, local entertainment offerings and the opening of
new attractions. Our theme parks generally experience peak attendance during the summer months when
schools are closed and during early winter and spring holiday periods.
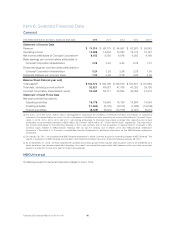
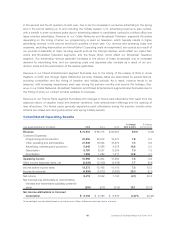
Consolidated Operating Results
Year ended December 31 (in millions) 2015 2014 2013
% Change
2014 to 2015
% Change
2013 to 2014
Revenue $ 74,510 $ 68,775 $ 64,657 8.3% 6.4%
Costs and Expenses:
Programming and production 22,550 20,912 19,670 7.8 6.3
Other operating and administrative 21,339 19,854 18,575 7.5 6.9
Advertising, marketing and promotion 5,943 5,086 4,978 16.8 2.2
Depreciation 6,781 6,337 6,254 7.0 1.3
Amortization 1,899 1,682 1,617 12.8 4.1
Operating income 15,998 14,904 13,563 7.3 9.9
Other income (expense) items, net (2,626) (2,439) (2,448) 7.7 (0.4)
Income before income taxes 13,372 12,465 11,115 7.3 12.2
Income tax expense (4,959) (3,873) (3,980) 28.0 (2.7)
Net income 8,413 8,592 7,135 (2.1) 20.4
Net (income) loss attributable to noncontrolling
interests and redeemable subsidiary preferred
stock (250) (212) (319) 18.1 (33.3)
Net income attributable to Comcast
Corporation $ 8,163 $ 8,380 $ 6,816 (2.6)% 22.9%
All percentages are calculated based on actual amounts. Minor differences may exist due to rounding.
45 Comcast 2015 Annual Report on Form 10-K