Comcast 2015 Annual Report Download - page 60
Download and view the complete annual report
Please find page 60 of the 2015 Comcast annual report below. You can navigate through the pages in the report by either clicking on the pages listed below, or by using the keyword search tool below to find specific information within the annual report.-
 1
1 -
2
-
3
-
4
-
5
-
6
-
7
-
8
-
9
-
10
-
11
-
12
-
13
-
14
-
15
-
16
-
17
-
18
-
19
-
20
-
21
-
22
-
23
-
24
-
25
-
26
-
27
-
28
-
29
-
30
-
31
-
32
-
33
-
34
-
35
-
36
-
37
-
38
-
39
-
40
-
41
-
42
-
43
-
44
-
45
-
46
-
47
-
48
-
49
-
 50
50 -
 51
51 -
 52
52 -
 53
53 -
 54
54 -
 55
55 -
 56
56 -
 57
57 -
 58
58 -
 59
59 -
 60
60 -
 61
61 -
 62
62 -
 63
63 -
 64
64 -
 65
65 -
 66
66 -
 67
67 -
 68
68 -
 69
69 -
 70
70 -
71
-
72
-
73
-
74
-
75
-
76
-
77
-
78
-
79
-
80
-
81
-
82
-
83
-
84
-
85
-
86
-
87
-
88
-
89
-
90
-
91
-
92
-
93
-
94
-
95
-
96
-
97
-
98
-
99
-
100
-
101
-
102
-
103
-
104
-
105
-
106
-
107
-
108
-
109
-
110
-
111
-
112
-
113
-
114
-
115
-
116
-
117
-
118
-
119
-
120
-
121
-
122
-
123
-
124
-
125
-
126
-
127
-
128
-
129
-
130
-
131
-
132
-
133
-
134
-
135
-
136
-
137
-
138
-
139
-
140
-
141
-
142
-
143
-
144
-
145
-
146
-
147
-
148
-
149
-
150
-
151
-
152
-
153
-
154
-
155
-
156
-
157
-
158
-
159
-
160
-
161
-
162
-
163
-
164
-
165
-
166
-
167
-
168
-
169
-
170
-
171
-
172
-
173
-
174
-
175
-
176
-
177
-
178
 |
 |

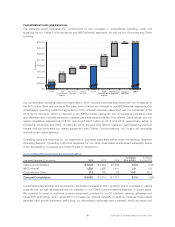
broadcast of the 2015 Super Bowl, the timing of content provided under our licensing agreements and higher
studio production costs. Programming and production costs increased in 2014 primarily due to costs asso-
ciated with our broadcast of the 2014 Sochi Olympics, as well as our continued investment in original
programming.
Other Operating and Administrative Costs and Expenses
Other operating and administrative costs and expenses include salaries, employee benefits, rent and other
overhead expenses.
Other operating and administrative costs increased in 2015 primarily due to an increase in employee-related
costs. Other operating and administrative costs and expenses remained flat in 2014.
Advertising, Marketing and Promotion Expenses
Advertising, marketing and promotion expenses consist primarily of the costs associated with promoting our
owned and licensed television programming, as well as the marketing of DVDs and costs associated with our
related digital media properties.
Advertising, marketing and promotion expenses increased in 2015 and 2014 primarily due to increased
spending on marketing associated with our NBC primetime lineup.
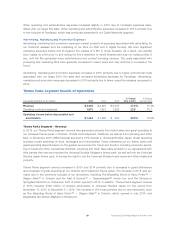
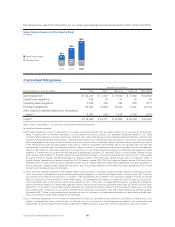
Filmed Entertainment Segment Results of Operations
Year ended December 31 (in millions) 2015 2014 2013
% Change
2014 to 2015
% Change
2013 to 2014
Revenue
Theatrical $ 2,829 $ 1,101 $ 1,568 156.9% (29.8)%
Content licensing 1,923 1,792 1,654 7.3 8.3
Home entertainment 1,801 1,457 1,828 23.6 (20.3)
Other 734 658 402 11.5 63.7
Total revenue 7,287 5,008 5,452 45.5 (8.2)
Operating costs and expenses
Programming and production 3,488 2,331 2,982 49.6 (21.8)
Other operating and administrative 872 849 716 2.8 18.5
Advertising, marketing and promotion 1,693 1,117 1,271 51.7 (12.2)
Total operating costs and expenses 6,053 4,297 4,969 40.9 (13.5)
Operating income before depreciation and
amortization $ 1,234 $ 711 $ 483 73.5% 47.3%
Filmed Entertainment Segment – Revenue
Theatrical
Theatrical revenue is generated from the worldwide theatrical release of our owned and acquired films for
exhibition in movie theaters and is significantly affected by the timing of each release and the number of films
we distribute, as well as their acceptance by audiences. Theatrical revenue is also affected by the number of
exhibition screens, ticket prices, the percentage of ticket sale retention by the exhibitors and the popularity of
competing films at the time our films are released. The success of a film in movie theaters is a significant
factor in determining the revenue a film is likely to generate in succeeding distribution platforms.
Theatrical revenue increased in 2015 primarily due to the strong performance of our larger 2015 film slate,
including Furious 7,Jurassic World and Minions. Theatrical revenue decreased in 2014 primarily due to the
57 Comcast 2015 Annual Report on Form 10-K