Comcast 2015 Annual Report Download - page 82
Download and view the complete annual report
Please find page 82 of the 2015 Comcast annual report below. You can navigate through the pages in the report by either clicking on the pages listed below, or by using the keyword search tool below to find specific information within the annual report.-
 1
1 -
2
-
3
-
4
-
5
-
6
-
7
-
8
-
9
-
10
-
11
-
12
-
13
-
14
-
15
-
16
-
17
-
18
-
19
-
20
-
21
-
22
-
23
-
24
-
25
-
26
-
27
-
28
-
29
-
30
-
31
-
32
-
33
-
34
-
35
-
36
-
37
-
38
-
39
-
40
-
41
-
42
-
43
-
44
-
45
-
46
-
47
-
48
-
49
-
50
-
51
-
52
-
53
-
54
-
55
-
56
-
57
-
58
-
59
-
60
-
61
-
62
-
63
-
64
-
65
-
66
-
67
-
68
-
69
-
70
-
71
-
 72
72 -
 73
73 -
 74
74 -
 75
75 -
 76
76 -
 77
77 -
 78
78 -
 79
79 -
 80
80 -
 81
81 -
 82
82 -
 83
83 -
 84
84 -
 85
85 -
 86
86 -
 87
87 -
 88
88 -
 89
89 -
 90
90 -
 91
91 -
 92
92 -
93
-
94
-
95
-
96
-
97
-
98
-
99
-
100
-
101
-
102
-
103
-
104
-
105
-
106
-
107
-
108
-
109
-
110
-
111
-
112
-
113
-
114
-
115
-
116
-
117
-
118
-
119
-
120
-
121
-
122
-
123
-
124
-
125
-
126
-
127
-
128
-
129
-
130
-
131
-
132
-
133
-
134
-
135
-
136
-
137
-
138
-
139
-
140
-
141
-
142
-
143
-
144
-
145
-
146
-
147
-
148
-
149
-
150
-
151
-
152
-
153
-
154
-
155
-
156
-
157
-
158
-
159
-
160
-
161
-
162
-
163
-
164
-
165
-
166
-
167
-
168
-
169
-
170
-
171
-
172
-
173
-
174
-
175
-
176
-
177
-
178
 |
 |

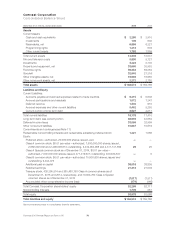
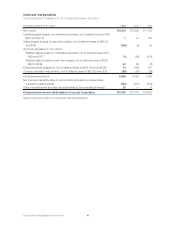
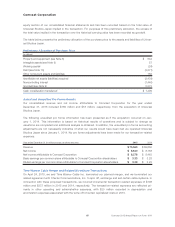
Comcast Corporation
Consolidated Statement of Cash Flows
Year ended December 31 (in millions) 2015 2014 2013
Operating Activities
Net income $ 8,413 $ 8,592 $ 7,135
Adjustments to reconcile net income to net cash provided by operating
activities:
Depreciation and amortization 8,680 8,019 7,871
Share-based compensation 567 513 419
Noncash interest expense (income), net 205 180 167
Equity in net (income) losses of investees, net 325 (97) 86
Cash received from investees 168 104 120
Net (gain) loss on investment activity and other (318) 4 (169)
Deferred income taxes 958 1,165 16
Changes in operating assets and liabilities, net of effects of acquisitions and
divestitures:
Current and noncurrent receivables, net (708) (33) (721)
Film and television costs, net (299) (562) 44
Accounts payable and accrued expenses related to trade creditors 384 153 (667)
Other operating assets and liabilities 403 (1,093) (141)
Net cash provided by operating activities 18,778 16,945 14,160
Investing Activities
Capital expenditures (8,499) (7,420) (6,596)
Cash paid for intangible assets (1,370) (1,122) (1,009)
Acquisitions and construction of real estate properties (178) (43) (1,904)
Acquisitions, net of cash acquired (1,786) (477) (99)
Proceeds from sales of businesses and investments 433 666 1,083
Purchases of investments (784) (191) (1,223)
Other 220 (146) 234
Net cash provided by (used in) investing activities (11,964) (8,733) (9,514)
Financing Activities
Proceeds from (repayments of) short-term borrowings, net 135 (504) 1,345
Proceeds from borrowings 5,486 4,182 2,933
Repurchases and repayments of debt (4,378) (3,175) (2,444)
Repurchases and retirements of common stock (6,750) (4,251) (2,000)
Dividends paid (2,437) (2,254) (1,964)
Issuances of common stock 36 35 40
Purchase of NBCUniversal noncontrolling common equity interest —— (10,761)
Distributions to noncontrolling interests and dividends for redeemable
subsidiary preferred stock (232) (220) (215)
Settlement of Station Venture liability —— (602)
Other (289) 167 (211)
Net cash provided by (used in) financing activities (8,429) (6,020) (13,879)
Increase (decrease) in cash and cash equivalents (1,615) 2,192 (9,233)
Cash and cash equivalents, beginning of year 3,910 1,718 10,951
Cash and cash equivalents, end of year $ 2,295 $ 3,910 $ 1,718
See accompanying notes to consolidated financial statements.
79 Comcast 2015 Annual Report on Form 10-K