Comcast 2015 Annual Report Download - page 109
Download and view the complete annual report
Please find page 109 of the 2015 Comcast annual report below. You can navigate through the pages in the report by either clicking on the pages listed below, or by using the keyword search tool below to find specific information within the annual report.-
 1
1 -
2
-
3
-
4
-
5
-
6
-
7
-
8
-
9
-
10
-
11
-
12
-
13
-
14
-
15
-
16
-
17
-
18
-
19
-
20
-
21
-
22
-
23
-
24
-
25
-
26
-
27
-
28
-
29
-
30
-
31
-
32
-
33
-
34
-
35
-
36
-
37
-
38
-
39
-
40
-
41
-
42
-
43
-
44
-
45
-
46
-
47
-
48
-
49
-
50
-
51
-
52
-
53
-
54
-
55
-
56
-
57
-
58
-
59
-
60
-
61
-
62
-
63
-
64
-
65
-
66
-
67
-
68
-
69
-
70
-
71
-
72
-
73
-
74
-
75
-
76
-
77
-
78
-
79
-
80
-
81
-
82
-
83
-
84
-
85
-
86
-
87
-
88
-
89
-
90
-
91
-
92
-
93
-
94
-
95
-
96
-
97
-
98
-
 99
99 -
 100
100 -
 101
101 -
 102
102 -
 103
103 -
 104
104 -
 105
105 -
 106
106 -
 107
107 -
 108
108 -
 109
109 -
 110
110 -
 111
111 -
 112
112 -
 113
113 -
 114
114 -
 115
115 -
 116
116 -
 117
117 -
 118
118 -
 119
119 -
120
-
121
-
122
-
123
-
124
-
125
-
126
-
127
-
128
-
129
-
130
-
131
-
132
-
133
-
134
-
135
-
136
-
137
-
138
-
139
-
140
-
141
-
142
-
143
-
144
-
145
-
146
-
147
-
148
-
149
-
150
-
151
-
152
-
153
-
154
-
155
-
156
-
157
-
158
-
159
-
160
-
161
-
162
-
163
-
164
-
165
-
166
-
167
-
168
-
169
-
170
-
171
-
172
-
173
-
174
-
175
-
176
-
177
-
178
 |
 |

Comcast Corporation
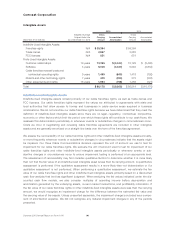
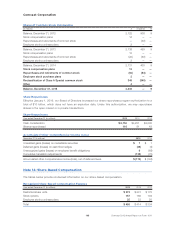
As of December 31, 2015, we had unrecognized pretax compensation expense of $635 million related to
nonvested RSUs and unrecognized pretax compensation expense of $337 million related to nonvested stock
options that will be recognized over a weighted-average period of approximately 1.8 years and 1.8 years,
respectively. In 2015, 2014 and 2013, we recorded increases to additional paid-in capital of $311 million,
$299 million and $244 million, respectively, which were the result of tax benefits associated with our share-
based compensation plans.
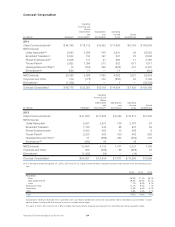
Stock Options and Restricted Share Units
As of December 31, 2015, unless otherwise stated (in millions, except per share data)
Stock
Options RSUs
Awards granted during 2015 18 9
Weighted-average exercise price of awards granted during 2015 $ 59.39
Stock options outstanding and nonvested RSUs 94 23
Weighted-average exercise price of stock options outstanding $ 36.63
Weighted-average fair value at grant date of nonvested RSUs $ 44.19
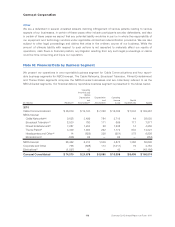
As of December 31, 2015, substantially all of our stock options outstanding were net settled stock options. Net set-
tled stock options, as opposed to stock options exercised with a cash payment, result in fewer shares being issued
and no cash proceeds being received by us when the options are exercised. Our share-based compensation primarily
consists of awards of RSUs and stock options to certain employees and directors as part of our approach to long-
term incentive compensation. Awards generally vest over a period of 5 years and in the case of stock options, have a
10 year term. Additionally, through our employee stock purchase plans, employees are able to purchase shares of
Comcast common stock at a discount through payroll deductions.
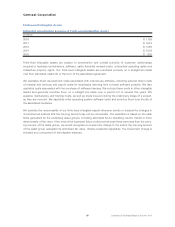
The cost associated with our share-based compensation is based on an award’s estimated fair value at the
date of grant and is recognized over the period in which any related services are provided. RSUs are valued
based on the closing price of our common stock on the date of grant and are discounted for the lack of divi-
dends, if any, during the vesting period. We use the Black-Scholes option pricing model to estimate the fair
value of stock option awards. The table below presents the weighted-average fair value on the date of grant
of RSUs and stock options awarded under our various plans and the related weighted-average valuation
assumptions.
Year ended December 31 2015 2014 2013
RSUs fair value $ 58.81 $47.91 $ 38.28
Stock options fair value $ 11.78 $11.11 $ 8.80
Stock Option Valuation Assumptions:
Dividend yield 1.7% 1.8% 1.9%
Expected volatility 23.0% 24.0% 25.0%
Risk-free interest rate 1.6% 2.2% 1.3%
Expected option life (in years) 6.0 6.5 7.0
Comcast 2015 Annual Report on Form 10-K 106