Comcast 2015 Annual Report Download - page 50
Download and view the complete annual report
Please find page 50 of the 2015 Comcast annual report below. You can navigate through the pages in the report by either clicking on the pages listed below, or by using the keyword search tool below to find specific information within the annual report.-
 1
1 -
2
-
3
-
4
-
5
-
6
-
7
-
8
-
9
-
10
-
11
-
12
-
13
-
14
-
15
-
16
-
17
-
18
-
19
-
20
-
21
-
22
-
23
-
24
-
25
-
26
-
27
-
28
-
29
-
30
-
31
-
32
-
33
-
34
-
35
-
36
-
37
-
38
-
39
-
 40
40 -
 41
41 -
 42
42 -
 43
43 -
 44
44 -
 45
45 -
 46
46 -
 47
47 -
 48
48 -
 49
49 -
 50
50 -
 51
51 -
 52
52 -
 53
53 -
 54
54 -
 55
55 -
 56
56 -
 57
57 -
 58
58 -
 59
59 -
 60
60 -
61
-
62
-
63
-
64
-
65
-
66
-
67
-
68
-
69
-
70
-
71
-
72
-
73
-
74
-
75
-
76
-
77
-
78
-
79
-
80
-
81
-
82
-
83
-
84
-
85
-
86
-
87
-
88
-
89
-
90
-
91
-
92
-
93
-
94
-
95
-
96
-
97
-
98
-
99
-
100
-
101
-
102
-
103
-
104
-
105
-
106
-
107
-
108
-
109
-
110
-
111
-
112
-
113
-
114
-
115
-
116
-
117
-
118
-
119
-
120
-
121
-
122
-
123
-
124
-
125
-
126
-
127
-
128
-
129
-
130
-
131
-
132
-
133
-
134
-
135
-
136
-
137
-
138
-
139
-
140
-
141
-
142
-
143
-
144
-
145
-
146
-
147
-
148
-
149
-
150
-
151
-
152
-
153
-
154
-
155
-
156
-
157
-
158
-
159
-
160
-
161
-
162
-
163
-
164
-
165
-
166
-
167
-
168
-
169
-
170
-
171
-
172
-
173
-
174
-
175
-
176
-
177
-
178
 |
 |

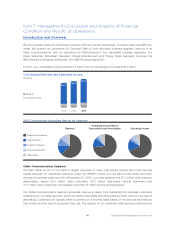
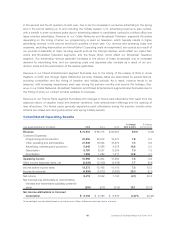
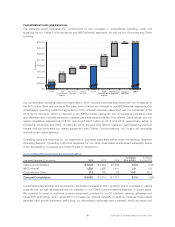
Consolidated Costs and Expenses
The following graph illustrates the contributions to the increases in consolidated operating costs and
expenses by our Cable Communications and NBCUniversal segments, as well as our Corporate and Other
activities.
$0
$43,000
$44,000
$45,000
$46,000
$47,000
$48,000
$50,000
$49,000
(in millions)
2013 2015
Cable
Communications
Segment
NBCUniversal
Segments
Corporate
and Other
2014
Cable
Communications
Segment
NBCUniversal
Segments
Corporate
and Other
$43,223
$1,397
$41 $49,832
$922 $310 $45,852
$1,731
$2,208
Our consolidated operating costs and expenses in 2015 included expenses associated with our broadcast of
the 2015 Super Bowl and our larger film slate, both of which are included in our NBCUniversal segments. Our
consolidated operating costs and expenses in 2014 included expenses associated with our broadcast of the
2014 Sochi Olympics, which is reported in our NBCUniversal segments. Our consolidated operating costs
and expenses also included transaction-related costs associated with the Time Warner Cable merger and the
related divestiture transactions of $178 million and $237 million in 2015 and 2014, respectively, which is
included in Corporate and Other. On April 24, 2015, we and Time Warner Cable Inc. terminated our planned
merger and we terminated our related agreement with Charter Communications, Inc. to spin off, exchange
and sell certain cable systems.
Operating costs and expenses for our segments is discussed separately below under the heading “Segment
Operating Results.” Operating costs and expenses for our other businesses is discussed separately below
under the heading “Corporate and Other Results of Operations.”
Consolidated Depreciation and Amortization
Year ended December 31 (in millions) 2015 2014 2013
% Change
2014 to 2015
% Change
2013 to 2014
Cable Communications $ 7,028 $ 6,422 $ 6,394 9.4% 0.4%
NBCUniversal 1,539 1,495 1,411 2.9 5.9
Corporate and Other 113 102 66 10.3 58.1
Comcast Consolidated $ 8,680 $ 8,019 $ 7,871 8.2% 1.9%
Consolidated depreciation and amortization expenses increased in 2015 primarily due to increases in capital
expenditures, as well as expenditures for software, in our Cable Communications segment in recent years.
We continue to invest in customer premise equipment, primarily for our X1 platform, wireless gateways and
Cloud DVR technology, and in equipment to increase our network capacity. In addition, because these assets
generally have shorter estimated useful lives, our depreciation expenses have increased, which we expect will
47 Comcast 2015 Annual Report on Form 10-K