Comcast 2015 Annual Report Download - page 63
Download and view the complete annual report
Please find page 63 of the 2015 Comcast annual report below. You can navigate through the pages in the report by either clicking on the pages listed below, or by using the keyword search tool below to find specific information within the annual report.-
 1
1 -
2
-
3
-
4
-
5
-
6
-
7
-
8
-
9
-
10
-
11
-
12
-
13
-
14
-
15
-
16
-
17
-
18
-
19
-
20
-
21
-
22
-
23
-
24
-
25
-
26
-
27
-
28
-
29
-
30
-
31
-
32
-
33
-
34
-
35
-
36
-
37
-
38
-
39
-
40
-
41
-
42
-
43
-
44
-
45
-
46
-
47
-
48
-
49
-
50
-
51
-
52
-
 53
53 -
 54
54 -
 55
55 -
 56
56 -
 57
57 -
 58
58 -
 59
59 -
 60
60 -
 61
61 -
 62
62 -
 63
63 -
 64
64 -
 65
65 -
 66
66 -
 67
67 -
 68
68 -
 69
69 -
 70
70 -
 71
71 -
 72
72 -
 73
73 -
74
-
75
-
76
-
77
-
78
-
79
-
80
-
81
-
82
-
83
-
84
-
85
-
86
-
87
-
88
-
89
-
90
-
91
-
92
-
93
-
94
-
95
-
96
-
97
-
98
-
99
-
100
-
101
-
102
-
103
-
104
-
105
-
106
-
107
-
108
-
109
-
110
-
111
-
112
-
113
-
114
-
115
-
116
-
117
-
118
-
119
-
120
-
121
-
122
-
123
-
124
-
125
-
126
-
127
-
128
-
129
-
130
-
131
-
132
-
133
-
134
-
135
-
136
-
137
-
138
-
139
-
140
-
141
-
142
-
143
-
144
-
145
-
146
-
147
-
148
-
149
-
150
-
151
-
152
-
153
-
154
-
155
-
156
-
157
-
158
-
159
-
160
-
161
-
162
-
163
-
164
-
165
-
166
-
167
-
168
-
169
-
170
-
171
-
172
-
173
-
174
-
175
-
176
-
177
-
178
 |
 |

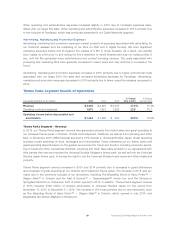
Theme Parks Segment – Operating Costs and Expenses
Our Theme Parks segment operating costs and expenses consist primarily of theme park operations, includ-
ing repairs and maintenance and related administrative expenses; food, beverage and merchandise costs;
labor costs; and sales and marketing costs.
Theme Parks segment operating costs and expenses increased in 2015 and 2014 primarily due to additional
costs at our Orlando and Hollywood theme parks associated with newer attractions, such as the Fast Fur-
ious™ — Supercharged™ studio tour in Hollywood in 2015 and The Wizarding World of Harry Potter™ —
Diagon Alley™ in Orlando in 2014 and increases in food, beverage and merchandise costs associated with
the increases in attendance in both years. Operating costs and expenses also increased in 2015 due to $89
million of operating costs and expenses attributable to Universal Studios Japan and $22 million of transaction
costs related to our development of a theme park in China.
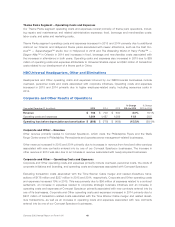
NBCUniversal Headquarters, Other and Eliminations
Headquarters and Other operating costs and expenses incurred by our NBCUniversal businesses include
overhead, personnel costs and costs associated with corporate initiatives. Operating costs and expenses
increased in 2015 and 2014 primarily due to higher employee-related costs, including severance costs in
2014.
Corporate and Other Results of Operations
Year ended December 31 (in millions) 2015 2014 2013
% Change
2014 to 2015
% Change
2013 to 2014
Revenue $ 766 $ 709 $ 600 8.0% 18.1%
Operating costs and expenses 1,664 1,487 1,089 11.9 36.5
Operating loss before depreciation and amortization $ (898) $ (778) $ (489) (15.5)% (59.1)%
Corporate and Other – Revenue
Other revenue primarily relates to Comcast Spectacor, which owns the Philadelphia Flyers and the Wells
Fargo Center arena in Philadelphia, Pennsylvania and operates arena management-related businesses.
Other revenue increased in 2015 and 2014 primarily due to increases in revenue from food and other services
associated with new contracts entered into by one of our Comcast Spectacor businesses. The increase in
other revenue in 2014 was also due to an increase in revenue associated with newly acquired businesses.
Corporate and Other – Operating Costs and Expenses
Corporate and Other operating costs and expenses primarily include overhead, personnel costs, the costs of
corporate initiatives and branding, and operating costs and expenses associated with Comcast Spectacor.
Excluding transaction costs associated with the Time Warner Cable merger and related divestiture trans-
actions of $178 million and $237 million in 2015 and 2014, respectively, Corporate and Other operating costs
and expenses increased 19% in 2015. This was primarily due to $56 million of expenses related to a contract
settlement, an increase in expenses related to corporate strategic business initiatives and an increase in
operating costs and expenses at Comcast Spectacor primarily associated with new contracts entered into by
one of its businesses. Corporate and Other operating costs and expenses increased in 2014 primarily due to
$237 million of transaction-related costs associated with the Time Warner Cable merger and related divest-
iture transactions, as well as an increase in operating costs and expenses associated with new contracts
entered into by one of our Comcast Spectacor businesses.
Comcast 2015 Annual Report on Form 10-K 60