Comcast 2015 Annual Report Download - page 58
Download and view the complete annual report
Please find page 58 of the 2015 Comcast annual report below. You can navigate through the pages in the report by either clicking on the pages listed below, or by using the keyword search tool below to find specific information within the annual report.-
 1
1 -
2
-
3
-
4
-
5
-
6
-
7
-
8
-
9
-
10
-
11
-
12
-
13
-
14
-
15
-
16
-
17
-
18
-
19
-
20
-
21
-
22
-
23
-
24
-
25
-
26
-
27
-
28
-
29
-
30
-
31
-
32
-
33
-
34
-
35
-
36
-
37
-
38
-
39
-
40
-
41
-
42
-
43
-
44
-
45
-
46
-
47
-
 48
48 -
 49
49 -
 50
50 -
 51
51 -
 52
52 -
 53
53 -
 54
54 -
 55
55 -
 56
56 -
 57
57 -
 58
58 -
 59
59 -
 60
60 -
 61
61 -
 62
62 -
 63
63 -
 64
64 -
 65
65 -
 66
66 -
 67
67 -
 68
68 -
69
-
70
-
71
-
72
-
73
-
74
-
75
-
76
-
77
-
78
-
79
-
80
-
81
-
82
-
83
-
84
-
85
-
86
-
87
-
88
-
89
-
90
-
91
-
92
-
93
-
94
-
95
-
96
-
97
-
98
-
99
-
100
-
101
-
102
-
103
-
104
-
105
-
106
-
107
-
108
-
109
-
110
-
111
-
112
-
113
-
114
-
115
-
116
-
117
-
118
-
119
-
120
-
121
-
122
-
123
-
124
-
125
-
126
-
127
-
128
-
129
-
130
-
131
-
132
-
133
-
134
-
135
-
136
-
137
-
138
-
139
-
140
-
141
-
142
-
143
-
144
-
145
-
146
-
147
-
148
-
149
-
150
-
151
-
152
-
153
-
154
-
155
-
156
-
157
-
158
-
159
-
160
-
161
-
162
-
163
-
164
-
165
-
166
-
167
-
168
-
169
-
170
-
171
-
172
-
173
-
174
-
175
-
176
-
177
-
178
 |
 |

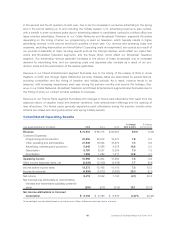
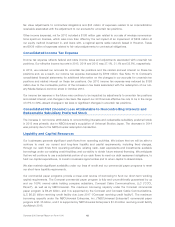
Programming and production costs increased in 2015 primarily due to our continued investment in program-
ming, including the premiere of NASCAR programming and other sports programming rights costs. These
increases were partially offset by costs in the prior year associated with our broadcast of the 2014 Sochi
Olympics. Programming and production costs increased in 2014 primarily due to costs associated with our
broadcast of the 2014 Sochi Olympics, as well as our continued investment in programming, including origi-
nal programming at our entertainment networks and sports programming rights costs. The increase in sports
programming rights costs in 2014 included the impact of a new rights agreement with a professional sports
team and costs associated with the first full year of our airing of English Premier League soccer.
Other Operating and Administrative Costs and Expenses
Other operating and administrative costs and expenses include salaries, employee benefits, rent and other
overhead expenses.
Other operating and administrative costs and expenses increased in 2015 primarily due to an increase in
employee-related costs. Other operating and administrative costs and expenses decreased in 2014 primarily
due to lower employee-related costs and the absence of the Style network and Fandango in 2014.
Advertising, Marketing and Promotion Expenses
Advertising, marketing and promotion expenses consist primarily of the costs associated with promoting our
cable networks programming and costs associated with our related digital media properties.
Advertising, marketing and promotion expenses increased in 2015 primarily due to an increase in marketing
expenses related to the launch of new programming on our cable networks. Advertising, marketing and
promotion expenses remained relatively flat in 2014.
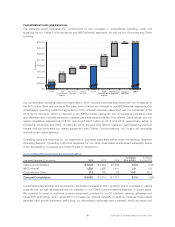
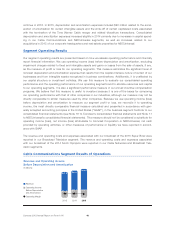
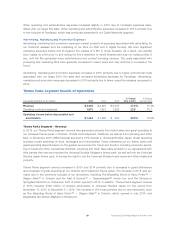
Broadcast Television Segment Results of Operations
Year ended December 31 (in millions) 2015 2014 2013
% Change
2014 to 2015
% Change
2013 to 2014
Revenue
Advertising $ 5,747 $ 5,888 $ 4,930 (2.4)% 19.4%
Content licensing 1,784 1,569 1,447 13.7 8.4
Other 999 1,085 743 (7.8) 46.0
Total revenue 8,530 8,542 7,120 (0.1) 20.0
Operating costs and expenses
Programming and production 5,950 6,127 5,192 (2.9) 18.0
Other operating and administrative 1,276 1,199 1,204 6.4 (0.4)
Advertising, marketing and promotion 524 482 379 8.9 27.0
Total operating costs and expenses 7,750 7,808 6,775 (0.7) 15.3
Operating income before depreciation and
amortization $ 780 $ 734 $ 345 6.3% 112.5%
Broadcast Television Segment – Revenue
Advertising
Advertising revenue is generated from the sale of advertising units sold on our broadcast networks, our
owned local television stations and our related digital media properties. Advertising revenue is primarily based
on the price we receive for each advertising unit, which is generally based on audience ratings and the value
of our viewer demographics to advertisers, and the number of advertising units we can place in our broadcast
55 Comcast 2015 Annual Report on Form 10-K