Comcast 2015 Annual Report Download - page 89
Download and view the complete annual report
Please find page 89 of the 2015 Comcast annual report below. You can navigate through the pages in the report by either clicking on the pages listed below, or by using the keyword search tool below to find specific information within the annual report.-
 1
1 -
2
-
3
-
4
-
5
-
6
-
7
-
8
-
9
-
10
-
11
-
12
-
13
-
14
-
15
-
16
-
17
-
18
-
19
-
20
-
21
-
22
-
23
-
24
-
25
-
26
-
27
-
28
-
29
-
30
-
31
-
32
-
33
-
34
-
35
-
36
-
37
-
38
-
39
-
40
-
41
-
42
-
43
-
44
-
45
-
46
-
47
-
48
-
49
-
50
-
51
-
52
-
53
-
54
-
55
-
56
-
57
-
58
-
59
-
60
-
61
-
62
-
63
-
64
-
65
-
66
-
67
-
68
-
69
-
70
-
71
-
72
-
73
-
74
-
75
-
76
-
77
-
78
-
 79
79 -
 80
80 -
 81
81 -
 82
82 -
 83
83 -
 84
84 -
 85
85 -
 86
86 -
 87
87 -
 88
88 -
 89
89 -
 90
90 -
 91
91 -
 92
92 -
 93
93 -
 94
94 -
 95
95 -
 96
96 -
 97
97 -
 98
98 -
 99
99 -
100
-
101
-
102
-
103
-
104
-
105
-
106
-
107
-
108
-
109
-
110
-
111
-
112
-
113
-
114
-
115
-
116
-
117
-
118
-
119
-
120
-
121
-
122
-
123
-
124
-
125
-
126
-
127
-
128
-
129
-
130
-
131
-
132
-
133
-
134
-
135
-
136
-
137
-
138
-
139
-
140
-
141
-
142
-
143
-
144
-
145
-
146
-
147
-
148
-
149
-
150
-
151
-
152
-
153
-
154
-
155
-
156
-
157
-
158
-
159
-
160
-
161
-
162
-
163
-
164
-
165
-
166
-
167
-
168
-
169
-
170
-
171
-
172
-
173
-
174
-
175
-
176
-
177
-
178
 |
 |

Comcast Corporation
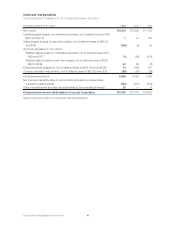
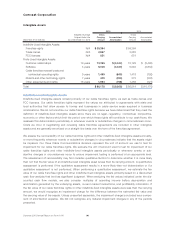
Note 4: Earnings Per Share
Computation of Diluted EPS
2015 2014 2013
Year ended December 31
(in millions, except per share data)
Net Income
Attributable
to Comcast
Corporation Shares
Per Share
Amount
Net Income
Attributable
to Comcast
Corporation Shares
Per Share
Amount
Net Income
Attributable
to Comcast
Corporation Shares
Per Share
Amount
Basic EPS attributable to Comcast
Corporation shareholders $ 8,163 2,486 $ 3.28 $ 8,380 2,583 $ 3.24 $ 6,816 2,625 $ 2.60
Effect of dilutive securities:
Assumed exercise or issuance
of shares relating to stock
plans 32 37 40
Diluted EPS attributable to
Comcast Corporation
shareholders $ 8,163 2,518 $ 3.24 $ 8,380 2,620 $ 3.20 $ 6,816 2,665 $ 2.56
Diluted earnings per common share attributable to Comcast Corporation shareholders (“diluted EPS”) consid-
ers the impact of potentially dilutive securities using the treasury stock method. Our potentially dilutive
securities include potential common shares related to our stock options and our restricted share units
(“RSUs”). Diluted EPS excludes the impact of potential common shares related to our stock options in peri-
ods in which the combination of the option exercise price and the associated unrecognized compensation
expense is greater than the average market price of our common stock.
The amount of potential common shares related to our share-based compensation plans that were excluded
from diluted EPS because their effect would have been antidilutive was not material for 2015, 2014 and 2013.
Note 5: Significant Transactions
2015
Universal Studios Japan
On November 13, 2015, NBCUniversal acquired a 51% economic interest in Universal Studios Japan for $1.5
billion. The acquisition was funded through cash on hand and borrowings under our commercial paper
program.
Universal Studios Japan is a VIE based on the governance structure and we consolidate Universal Studios
Japan as we have the power to direct activities that most significantly impact its economic performance.
There are no liquidity arrangements, guarantees, or other financial commitments between us and Universal
Studios Japan, and therefore our maximum risk of financial loss is NBCUniversal’s 51% interest. Universal
Studios Japan’s results of operations are reported in our Theme Parks segment following the acquisition
date.
Preliminary Allocation of Purchase Price
Due to the limited amount of time since the date of acquisition, the assets and liabilities of Universal Studios
Japan were recorded at their historical carrying values. We will adjust these amounts to fair value as valu-
ations are completed and we obtain information necessary to complete the analyses, but no later than one
year from the acquisition date. The 49% noncontrolling interest in Universal Studios Japan is recorded in the
Comcast 2015 Annual Report on Form 10-K 86