Comcast 2015 Annual Report Download - page 83
Download and view the complete annual report
Please find page 83 of the 2015 Comcast annual report below. You can navigate through the pages in the report by either clicking on the pages listed below, or by using the keyword search tool below to find specific information within the annual report.-
 1
1 -
2
-
3
-
4
-
5
-
6
-
7
-
8
-
9
-
10
-
11
-
12
-
13
-
14
-
15
-
16
-
17
-
18
-
19
-
20
-
21
-
22
-
23
-
24
-
25
-
26
-
27
-
28
-
29
-
30
-
31
-
32
-
33
-
34
-
35
-
36
-
37
-
38
-
39
-
40
-
41
-
42
-
43
-
44
-
45
-
46
-
47
-
48
-
49
-
50
-
51
-
52
-
53
-
54
-
55
-
56
-
57
-
58
-
59
-
60
-
61
-
62
-
63
-
64
-
65
-
66
-
67
-
68
-
69
-
70
-
71
-
72
-
 73
73 -
 74
74 -
 75
75 -
 76
76 -
 77
77 -
 78
78 -
 79
79 -
 80
80 -
 81
81 -
 82
82 -
 83
83 -
 84
84 -
 85
85 -
 86
86 -
 87
87 -
 88
88 -
 89
89 -
 90
90 -
 91
91 -
 92
92 -
 93
93 -
94
-
95
-
96
-
97
-
98
-
99
-
100
-
101
-
102
-
103
-
104
-
105
-
106
-
107
-
108
-
109
-
110
-
111
-
112
-
113
-
114
-
115
-
116
-
117
-
118
-
119
-
120
-
121
-
122
-
123
-
124
-
125
-
126
-
127
-
128
-
129
-
130
-
131
-
132
-
133
-
134
-
135
-
136
-
137
-
138
-
139
-
140
-
141
-
142
-
143
-
144
-
145
-
146
-
147
-
148
-
149
-
150
-
151
-
152
-
153
-
154
-
155
-
156
-
157
-
158
-
159
-
160
-
161
-
162
-
163
-
164
-
165
-
166
-
167
-
168
-
169
-
170
-
171
-
172
-
173
-
174
-
175
-
176
-
177
-
178
 |
 |

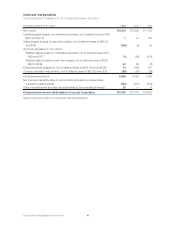
Comcast Corporation
Consolidated Statement of Changes in Equity
Redeemable
Noncontrolling
Interests and
Redeemable
Subsidiary
Preferred
Stock
Common Stock Additional
Paid-In
Capital
Retained
Earnings
Treasury
Stock at
Cost
Accumulated
Other
Comprehensive
Income (Loss)
Non-
controlling
Interests
Total
Equity
(in millions) A
A
Special B
Balance, December 31, 2012 $ 16,998 $ 25 $ 6 $ — $ 40,547 $ 16,280 $ (7,517) $ 15 $ 440 $ 49,796
Stock compensation plans 603 (371) 232
Repurchases and retirements of
common stock (1) (555) (1,444) (2,000)
Employee stock purchase plans 98 98
Dividends declared (2,046) (2,046)
Other comprehensive income
(loss) (9) 67 67
Purchase of NBCUniversal
noncontrolling common equity
interest (17,006) (1,651) (26) (1,677)
Redeemable subsidiary preferred
stock 725
Contributions from (distributions
to) noncontrolling interests, net (22) (136) (136)
Other 70 (152) (58) (210)
Net income (loss) 201 6,816 118 6,934
Balance, December 31, 2013 957 25 5 — 38,890 19,235 (7,517) 56 364 51,058
Stock compensation plans 732 (433) 299
Repurchases and retirements of
common stock (928) (3,323) (4,251)
Employee stock purchase plans 118 118
Dividends declared (2,320) (2,320)
Other comprehensive income
(loss) (202) (202)
Issuance of subsidiary shares to
noncontrolling interests 85 11 11
Contributions from (distributions
to) noncontrolling interests, net (19) (132) (132)
Other (33) (7) (22) (29)
Net income (loss) 76 8,380 136 8,516
Balance, December 31, 2014 1,066 25 5 — 38,805 21,539 (7,517) (146) 357 53,068
Stock compensation plans 739 (402) 337
Repurchases and retirements
of common stock (1) (1,345) (5,404) (6,750)
Employee stock purchase
plans 136 136
Dividends declared (2,483) (2,483)
Other comprehensive income
(loss) (28) (29) (57)
Contributions from
(distributions to)
noncontrolling interests, net 11 (146) (146)
Reclassification of Class A
Special common stock 4 (4) —
Universal Studios Japan 1,440 1,440
Other 58 183 (77) 106
Net income (loss) 86 8,163 164 8,327
Balance, December 31, 2015 $ 1,221 $ 29 $ — $ — $ 38,518 $ 21,413 $ (7,517) $ (174)$ 1,709 $ 53,978
See accompanying notes to consolidated financial statements.
Comcast 2011 Annual Report on Form 10-K 80