Comcast 2015 Annual Report Download - page 42
Download and view the complete annual report
Please find page 42 of the 2015 Comcast annual report below. You can navigate through the pages in the report by either clicking on the pages listed below, or by using the keyword search tool below to find specific information within the annual report.-
 1
1 -
2
-
3
-
4
-
5
-
6
-
7
-
8
-
9
-
10
-
11
-
12
-
13
-
14
-
15
-
16
-
17
-
18
-
19
-
20
-
21
-
22
-
23
-
24
-
25
-
26
-
27
-
28
-
29
-
30
-
31
-
 32
32 -
 33
33 -
 34
34 -
 35
35 -
 36
36 -
 37
37 -
 38
38 -
 39
39 -
 40
40 -
 41
41 -
 42
42 -
 43
43 -
 44
44 -
 45
45 -
 46
46 -
 47
47 -
 48
48 -
 49
49 -
 50
50 -
 51
51 -
 52
52 -
53
-
54
-
55
-
56
-
57
-
58
-
59
-
60
-
61
-
62
-
63
-
64
-
65
-
66
-
67
-
68
-
69
-
70
-
71
-
72
-
73
-
74
-
75
-
76
-
77
-
78
-
79
-
80
-
81
-
82
-
83
-
84
-
85
-
86
-
87
-
88
-
89
-
90
-
91
-
92
-
93
-
94
-
95
-
96
-
97
-
98
-
99
-
100
-
101
-
102
-
103
-
104
-
105
-
106
-
107
-
108
-
109
-
110
-
111
-
112
-
113
-
114
-
115
-
116
-
117
-
118
-
119
-
120
-
121
-
122
-
123
-
124
-
125
-
126
-
127
-
128
-
129
-
130
-
131
-
132
-
133
-
134
-
135
-
136
-
137
-
138
-
139
-
140
-
141
-
142
-
143
-
144
-
145
-
146
-
147
-
148
-
149
-
150
-
151
-
152
-
153
-
154
-
155
-
156
-
157
-
158
-
159
-
160
-
161
-
162
-
163
-
164
-
165
-
166
-
167
-
168
-
169
-
170
-
171
-
172
-
173
-
174
-
175
-
176
-
177
-
178
 |
 |

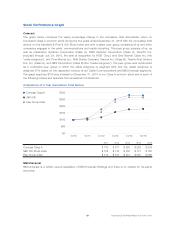
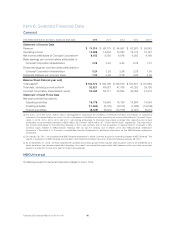
Stock Performance Graph
Comcast
The graph below compares the yearly percentage change in the cumulative total shareholder return on
Comcast’s Class A common stock during the five years ended December 31, 2015 with the cumulative total
returns on the Standard & Poor’s 500 Stock Index and with a select peer group consisting of us and other
companies engaged in the cable, communications and media industries. This peer group consists of us, as
well as Cablevision Systems Corporation (Class A), DISH Network Corporation (Class A), DirecTV Inc.
(included through July 24, 2015, the date of acquisition by AT&T Corp.) and Time Warner Cable Inc. (the
“cable subgroup”), and Time Warner Inc., Walt Disney Company, Viacom Inc. (Class B), Twenty-First Century
Fox, Inc. (Class A), and CBS Corporation (Class B) (the “media subgroup”). The peer group was constructed
as a composite peer group in which the cable subgroup is weighted 63% and the media subgroup is
weighted 37% based on the respective revenue of our Cable Communications and NBCUniversal segments.
The graph assumes $100 was invested on December 31, 2010 in our Class A common stock and in each of
the following indices and assumes the reinvestment of dividends.
Comparison of 5 Year Cumulative Total Return
12/11
$0
$200
$150
$100
$50
$300
$250
12/1412/1312/1212/10 12/15
Comcast Class A
S&P 500
Peer Group Index
2011 2012 2013 2014 2015
Comcast Class A $ 110 $ 177 $ 250 $ 282 $ 279
S&P 500 Stock Index $ 102 $ 118 $ 156 $ 177 $ 180
Peer Group Index $ 110 $ 157 $ 231 $ 267 $ 265
NBCUniversal
NBCUniversal is a wholly owned subsidiary of NBCUniversal Holdings and there is no market for its equity
securities.
39 Comcast 2015 Annual Report on Form 10-K