Comcast 2015 Annual Report Download - page 53
Download and view the complete annual report
Please find page 53 of the 2015 Comcast annual report below. You can navigate through the pages in the report by either clicking on the pages listed below, or by using the keyword search tool below to find specific information within the annual report.-
 1
1 -
2
-
3
-
4
-
5
-
6
-
7
-
8
-
9
-
10
-
11
-
12
-
13
-
14
-
15
-
16
-
17
-
18
-
19
-
20
-
21
-
22
-
23
-
24
-
25
-
26
-
27
-
28
-
29
-
30
-
31
-
32
-
33
-
34
-
35
-
36
-
37
-
38
-
39
-
40
-
41
-
42
-
 43
43 -
 44
44 -
 45
45 -
 46
46 -
 47
47 -
 48
48 -
 49
49 -
 50
50 -
 51
51 -
 52
52 -
 53
53 -
 54
54 -
 55
55 -
 56
56 -
 57
57 -
 58
58 -
 59
59 -
 60
60 -
 61
61 -
 62
62 -
 63
63 -
64
-
65
-
66
-
67
-
68
-
69
-
70
-
71
-
72
-
73
-
74
-
75
-
76
-
77
-
78
-
79
-
80
-
81
-
82
-
83
-
84
-
85
-
86
-
87
-
88
-
89
-
90
-
91
-
92
-
93
-
94
-
95
-
96
-
97
-
98
-
99
-
100
-
101
-
102
-
103
-
104
-
105
-
106
-
107
-
108
-
109
-
110
-
111
-
112
-
113
-
114
-
115
-
116
-
117
-
118
-
119
-
120
-
121
-
122
-
123
-
124
-
125
-
126
-
127
-
128
-
129
-
130
-
131
-
132
-
133
-
134
-
135
-
136
-
137
-
138
-
139
-
140
-
141
-
142
-
143
-
144
-
145
-
146
-
147
-
148
-
149
-
150
-
151
-
152
-
153
-
154
-
155
-
156
-
157
-
158
-
159
-
160
-
161
-
162
-
163
-
164
-
165
-
166
-
167
-
168
-
169
-
170
-
171
-
172
-
173
-
174
-
175
-
176
-
177
-
178
 |
 |
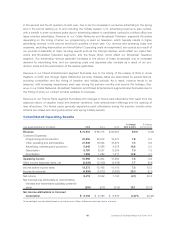
respectively. The decreases in the number of residential video customers in 2015 and 2014 were primarily
due to competitive pressures and the impact of rate adjustments.
As of December 31, 2015, 40.1% of the homes and businesses in the areas we serve subscribed to our
video services, compared to 40.9% and 41.9% as of December 31, 2014 and 2013, respectively. We may
experience further declines in the number of residential video customers.
High-Speed Internet
High-speed Internet revenue increased 10.2% and 9.5% in 2015 and 2014, respectively. Increases in the
number of residential customers receiving our high-speed Internet services accounted for increases in rev-
enue of 5.8% and 5.9% in 2015 and 2014, respectively. The remaining increases in revenue in both 2015 and
2014 were primarily due to increases in the number of customers receiving higher levels of service and rate
adjustments.
As of December 31, 2015, 41.9% of the homes and businesses in the areas we serve subscribed to our high-
speed Internet services, compared to 40.2% and 38.4% as of December 31, 2014 and 2013, respectively.
Our customer base continues to grow as consumers choose our high-speed Internet service and seek
higher-speed offerings.
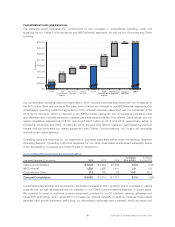
Voice
Voice revenue decreased 1.7% in 2015 and increased slightly in 2014. While the number of residential cus-
tomers receiving voice services through our discounted bundled service offerings increased in both years,
revenue was negatively impacted by the allocation of voice revenue for our customers who receive bundled
services. The amount allocated to voice revenue in the rate charged for bundled services decreased in 2015
and 2014 because video and high-speed Internet rates increased while voice rates remained relatively flat.
As of December 31, 2015, 20.6% of the homes and businesses in the areas we serve subscribed to our voice
services, compared to 20.5% and 19.9% as of December 31, 2014 and 2013, respectively.
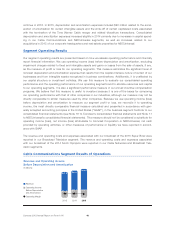
Business Services
Business services revenue increased 20.0% and 21.9% in 2015 and 2014, respectively. The increases in
2015 and 2014 were primarily due to increases in the number of small business customers receiving our
high-speed Internet and voice services and rate adjustments. In 2015, 2014 and 2013, our small business
customers represented more than 70% of total business services revenue. The remaining increases in both
years were primarily due to continued growth in our medium-sized business services, including Ethernet
network and advanced voice services.
We believe the increases in the number of business customers were primarily the result of our efforts to gain
market share from competitors by offering competitive services and pricing.
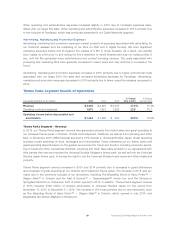
Advertising
As part of our distribution agreements with cable networks, we generally receive an allocation of scheduled
advertising time on cable networks that our Spotlight business sells to local, regional and national advertisers.
In most cases, the available advertising units are sold by our sales force. In some cases, we work with repre-
sentation firms as an extension of our sales force to sell a portion of the advertising time allocated to us. We
also represent the advertising sales efforts of other multichannel video providers in some markets. In addition,
we generate revenue from the sale of advertising online and on our On Demand service. Advertising revenue
is affected by the strength of the advertising market and general economic conditions.
Advertising revenue decreased 3.1% in 2015 primarily due to a decrease in political advertising revenue.
Excluding the impact of political advertising revenue, advertising revenue increased 3.7% in 2015. Advertising
Comcast 2015 Annual Report on Form 10-K 50