Comcast 2015 Annual Report Download - page 103
Download and view the complete annual report
Please find page 103 of the 2015 Comcast annual report below. You can navigate through the pages in the report by either clicking on the pages listed below, or by using the keyword search tool below to find specific information within the annual report.-
 1
1 -
2
-
3
-
4
-
5
-
6
-
7
-
8
-
9
-
10
-
11
-
12
-
13
-
14
-
15
-
16
-
17
-
18
-
19
-
20
-
21
-
22
-
23
-
24
-
25
-
26
-
27
-
28
-
29
-
30
-
31
-
32
-
33
-
34
-
35
-
36
-
37
-
38
-
39
-
40
-
41
-
42
-
43
-
44
-
45
-
46
-
47
-
48
-
49
-
50
-
51
-
52
-
53
-
54
-
55
-
56
-
57
-
58
-
59
-
60
-
61
-
62
-
63
-
64
-
65
-
66
-
67
-
68
-
69
-
70
-
71
-
72
-
73
-
74
-
75
-
76
-
77
-
78
-
79
-
80
-
81
-
82
-
83
-
84
-
85
-
86
-
87
-
88
-
89
-
90
-
91
-
92
-
 93
93 -
 94
94 -
 95
95 -
 96
96 -
 97
97 -
 98
98 -
 99
99 -
 100
100 -
 101
101 -
 102
102 -
 103
103 -
 104
104 -
 105
105 -
 106
106 -
 107
107 -
 108
108 -
 109
109 -
 110
110 -
 111
111 -
 112
112 -
 113
113 -
114
-
115
-
116
-
117
-
118
-
119
-
120
-
121
-
122
-
123
-
124
-
125
-
126
-
127
-
128
-
129
-
130
-
131
-
132
-
133
-
134
-
135
-
136
-
137
-
138
-
139
-
140
-
141
-
142
-
143
-
144
-
145
-
146
-
147
-
148
-
149
-
150
-
151
-
152
-
153
-
154
-
155
-
156
-
157
-
158
-
159
-
160
-
161
-
162
-
163
-
164
-
165
-
166
-
167
-
168
-
169
-
170
-
171
-
172
-
173
-
174
-
175
-
176
-
177
-
178
 |
 |

Comcast Corporation
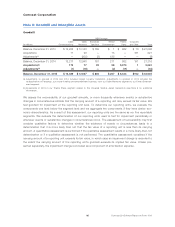
Note 11: Fair Value Measurements
The accounting guidance related to financial assets and financial liabilities (“financial instruments”) establishes
a hierarchy that prioritizes fair value measurements based on the types of inputs used for the various valu-
ation techniques (market approach, income approach and cost approach). The levels of the hierarchy are
described below.
• Level 1: Consists of financial instruments whose values are based on quoted market
prices for identical financial instruments in an active market.
• Level 2: Consists of financial instruments that are valued using models or other valu-
ation methodologies. These models use inputs that are observable either directly or
indirectly. Level 2 inputs include (1) quoted prices for similar assets or liabilities in
active markets, (2) quoted prices for identical or similar assets or liabilities in markets
that are not active, (3) pricing models whose inputs are observable for substantially
the full term of the financial instrument and (4) pricing models whose inputs are
derived primarily from or corroborated by observable market data through correlation
or other means for substantially the full term of the financial instrument.
• Level 3: Consists of financial instruments whose values are determined using pricing
models that use significant inputs that are primarily unobservable, discounted cash
flow methodologies or similar techniques, as well as instruments for which the
determination of fair value requires significant management judgment or estimation.
Our assessment of the significance of a particular input to the fair value measurement requires judgment and
may affect the valuation of financial instruments and their classification within the fair value hierarchy. Finan-
cial instruments are classified in their entirety based on the lowest level of input that is significant to the fair
value measurement. There have been no changes in the classification of any financial instruments within the
fair value hierarchy in the periods presented. Our financial instruments that are accounted for at fair value on
a recurring basis are presented in the table below.
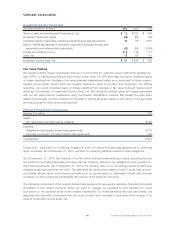
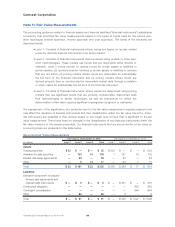
Recurring Fair Value Measurements
Fair Value as of December 31, 2015 Fair Value as of December 31, 2014
(in millions) Level 1 Level 2 Level 3 Total Level 1 Level 2 Level 3 Total
Assets
Trading securities $22 $ — $ — $ 22 $ 523 $ — $ — $ 523
Available-for-sale securities — 123 10 133 1 121 10 132
Interest rate swap agreements —53—53—84 — 84
Other — 5 12 17 —64 7 71
Total $ 22 $ 181 $ 22 $ 225 $ 524 $ 269 $ 17 $ 810
Liabilities
Derivative component of prepaid
forward sale agreements and
indexed debt instruments $— $ 5 $— $ 5 $ — $ 361 $ — $ 361
Contractual obligation ————— — 883 883
Contingent consideration ————— — 644 644
Other —86—86—8 — 8
Total $— $ 91 $— $ 91 $ — $ 369 $ 1,527 $ 1,896
Comcast 2015 Annual Report on Form 10-K 100