Comcast 2015 Annual Report Download - page 59
Download and view the complete annual report
Please find page 59 of the 2015 Comcast annual report below. You can navigate through the pages in the report by either clicking on the pages listed below, or by using the keyword search tool below to find specific information within the annual report.-
 1
1 -
2
-
3
-
4
-
5
-
6
-
7
-
8
-
9
-
10
-
11
-
12
-
13
-
14
-
15
-
16
-
17
-
18
-
19
-
20
-
21
-
22
-
23
-
24
-
25
-
26
-
27
-
28
-
29
-
30
-
31
-
32
-
33
-
34
-
35
-
36
-
37
-
38
-
39
-
40
-
41
-
42
-
43
-
44
-
45
-
46
-
47
-
48
-
 49
49 -
 50
50 -
 51
51 -
 52
52 -
 53
53 -
 54
54 -
 55
55 -
 56
56 -
 57
57 -
 58
58 -
 59
59 -
 60
60 -
 61
61 -
 62
62 -
 63
63 -
 64
64 -
 65
65 -
 66
66 -
 67
67 -
 68
68 -
 69
69 -
70
-
71
-
72
-
73
-
74
-
75
-
76
-
77
-
78
-
79
-
80
-
81
-
82
-
83
-
84
-
85
-
86
-
87
-
88
-
89
-
90
-
91
-
92
-
93
-
94
-
95
-
96
-
97
-
98
-
99
-
100
-
101
-
102
-
103
-
104
-
105
-
106
-
107
-
108
-
109
-
110
-
111
-
112
-
113
-
114
-
115
-
116
-
117
-
118
-
119
-
120
-
121
-
122
-
123
-
124
-
125
-
126
-
127
-
128
-
129
-
130
-
131
-
132
-
133
-
134
-
135
-
136
-
137
-
138
-
139
-
140
-
141
-
142
-
143
-
144
-
145
-
146
-
147
-
148
-
149
-
150
-
151
-
152
-
153
-
154
-
155
-
156
-
157
-
158
-
159
-
160
-
161
-
162
-
163
-
164
-
165
-
166
-
167
-
168
-
169
-
170
-
171
-
172
-
173
-
174
-
175
-
176
-
177
-
178
 |
 |
networks’ and owned local television stations’ programming schedules. Advertising revenue is affected by the
strength of the national and local advertising markets, general economic conditions, cyclicality related to
political campaigns and issue-oriented advertising, and the success and ratings of our programming.
Advertising revenue decreased in 2015 primarily due to revenue in the prior year associated with our broad-
cast of the 2014 Sochi Olympics, which was partially offset by an increase in advertising revenue in the
current year associated with our broadcast of the 2015 Super Bowl. Advertising revenue increased in 2014
primarily due to revenue associated with our broadcast of the 2014 Sochi Olympics. Excluding $730 million of
revenue associated with our broadcast of the 2014 Sochi Olympics and $376 million of revenue associated
with our broadcast of the 2015 Super Bowl, revenue increased 4.1% and 4.6% in 2015 and 2014,
respectively, primarily due to higher prices and increases in the volume of advertising units sold.
Content Licensing
Content licensing revenue is generated from the licensing of our owned programming in the United States
and internationally to various distribution platforms, including to cable and broadcast networks, as well as to
subscription video on demand services. In addition, our broadcast television production studio develops and
produces original content that it licenses to broadcast networks, cable networks and local broadcast tele-
vision stations owned by us and third parties, as well as to subscription video on demand services. The
production and distribution costs related to our owned programming generally exceed the revenue generated
from the initial network license, which means the subsequent licensing of our owned programming series fol-
lowing the initial network license is critical to their financial success.
Content licensing revenue increased in 2015 and 2014 primarily due to the timing of content provided under
our licensing agreements.
Other
We generate other revenue primarily from fees for retransmission consent of our owned local broadcast tele-
vision stations and associated fees received from NBC-affiliated local broadcast television stations, as well as
from the sale of our owned programming on DVD and through digital distribution services. The sale of our
owned programming is driven primarily by the popularity of our broadcast networks and programming series
and therefore fluctuates based on consumer spending and acceptance. Other revenue also includes dis-
tribution revenue associated with our periodic broadcasts of the Olympic Games.
Other revenue decreased in 2015 primarily due to distribution revenue in the prior year that was associated
with our broadcast of the 2014 Sochi Olympics. The decrease was partially offset by an increase in fees
recognized under our retransmission consent agreements, as well as new syndication agreements entered
into in 2015. Other revenue increased in 2014 primarily due to $116 million of distribution revenue that was
associated with our broadcast of the 2014 Sochi Olympics.
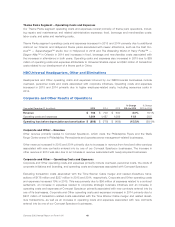
Broadcast Television Segment – Operating Costs and Expenses
Programming and Production Costs
Programming and production costs relate to content originating on our broadcast networks and owned local
broadcast television stations, as well as owned content that is licensed to third parties. These costs include
the amortization of owned and acquired programming costs, sports rights, direct production costs, residual
and participation payments, production overhead, costs associated with the distribution of our programming
to third-party networks and other distribution platforms, and on-air talent costs.
Programming and production costs decreased in 2015 primarily due to costs in the prior year associated with
our broadcast of the 2014 Sochi Olympics. The decrease was partially offset by costs associated with our
Comcast 2015 Annual Report on Form 10-K 56