Comcast 2015 Annual Report Download - page 120
Download and view the complete annual report
Please find page 120 of the 2015 Comcast annual report below. You can navigate through the pages in the report by either clicking on the pages listed below, or by using the keyword search tool below to find specific information within the annual report.-
 1
1 -
2
-
3
-
4
-
5
-
6
-
7
-
8
-
9
-
10
-
11
-
12
-
13
-
14
-
15
-
16
-
17
-
18
-
19
-
20
-
21
-
22
-
23
-
24
-
25
-
26
-
27
-
28
-
29
-
30
-
31
-
32
-
33
-
34
-
35
-
36
-
37
-
38
-
39
-
40
-
41
-
42
-
43
-
44
-
45
-
46
-
47
-
48
-
49
-
50
-
51
-
52
-
53
-
54
-
55
-
56
-
57
-
58
-
59
-
60
-
61
-
62
-
63
-
64
-
65
-
66
-
67
-
68
-
69
-
70
-
71
-
72
-
73
-
74
-
75
-
76
-
77
-
78
-
79
-
80
-
81
-
82
-
83
-
84
-
85
-
86
-
87
-
88
-
89
-
90
-
91
-
92
-
93
-
94
-
95
-
96
-
97
-
98
-
99
-
100
-
101
-
102
-
103
-
104
-
105
-
106
-
107
-
108
-
109
-
 110
110 -
 111
111 -
 112
112 -
 113
113 -
 114
114 -
 115
115 -
 116
116 -
 117
117 -
 118
118 -
 119
119 -
 120
120 -
 121
121 -
 122
122 -
 123
123 -
 124
124 -
 125
125 -
 126
126 -
 127
127 -
 128
128 -
 129
129 -
 130
130 -
131
-
132
-
133
-
134
-
135
-
136
-
137
-
138
-
139
-
140
-
141
-
142
-
143
-
144
-
145
-
146
-
147
-
148
-
149
-
150
-
151
-
152
-
153
-
154
-
155
-
156
-
157
-
158
-
159
-
160
-
161
-
162
-
163
-
164
-
165
-
166
-
167
-
168
-
169
-
170
-
171
-
172
-
173
-
174
-
175
-
176
-
177
-
178
 |
 |

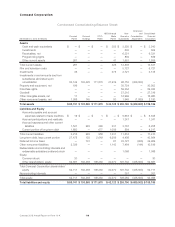
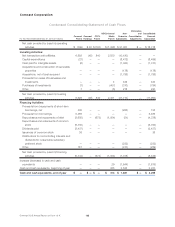
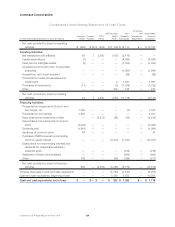
Comcast Corporation
Condensed Consolidating Balance Sheet
December 31, 2015 (in millions)
Comcast
Parent
Comcast
Holdings
CCCL
Parent
NBCUniversal
Media
Parent
Non-
Guarantor
Subsidiaries
Elimination
and
Consolidation
Adjustments
Consolidated
Comcast
Corporation
Assets
Cash and cash equivalents $ — $ — $ — $ 414 $ 1,881 $ — $ 2,295
Investments — — — — 106 — 106
Receivables, net — — — — 6,896 — 6,896
Programming rights — — — — 1,213 — 1,213
Other current assets 69 — — 17 1,707 — 1,793
Total current assets 69 — — 431 11,803 — 12,303
Film and television costs — — — — 5,855 — 5,855
Investments 33 — — 430 2,761 — 3,224
Investments in and amounts due from
subsidiaries eliminated upon
consolidation 87,142 111,241 119,354 42,441 109,598 (469,776) —
Property and equipment, net 210 — — — 33,455 — 33,665
Franchise rights — — — — 59,364 — 59,364
Goodwill — — — — 32,945 — 32,945
Other intangible assets, net 12 — — — 16,934 — 16,946
Other noncurrent assets, net 1,301 147 — 78 2,114 (1,368) 2,272
Total assets $ 88,767 $ 111,388 $ 119,354 $ 43,380 $ 274,829 $ (471,144) $ 166,574
Liabilities and Equity
Accounts payable and accrued
expenses related to trade creditors $ 16 $ — $ — $ — $ 6,199 $ — $ 6,215
Accrued participations and residuals — — — — 1,572 — 1,572
Accrued expenses and other current
liabilities 1,789 335 290 389 3,961 — 6,764
Current portion of long-term debt 1,149 — — 1,005 1,473 — 3,627
Total current liabilities 2,954 335 290 1,394 13,205 — 18,178
Long-term debt, less current portion 31,106 130 2,650 8,211 6,897 — 48,994
Deferred income taxes — 624 — 66 34,098 (1,222) 33,566
Other noncurrent liabilities 2,438 — — 1,087 7,258 (146) 10,637
Redeemable noncontrolling interests
and redeemable subsidiary preferred
stock — — — — 1,221 — 1,221
Equity:
Common stock 29 — — — — — 29
Other shareholders’ equity 52,240 110,299 116,414 32,622 210,441 (469,776) 52,240
Total Comcast Corporation
shareholders’ equity 52,269 110,299 116,414 32,622 210,441 (469,776) 52,269
Noncontrolling interests — — — — 1,709 — 1,709
Total equity 52,269 110,299 116,414 32,622 212,150 (469,776) 53,978
Total liabilities and equity $ 88,767 $ 111,388 $ 119,354 $ 43,380 $ 274,829 $ (471,144) $ 166,574
117 Comcast 2015 Annual Report on Form 10-K