Chrysler 2011 Annual Report Download - page 90
Download and view the complete annual report
Please find page 90 of the 2011 Chrysler annual report below. You can navigate through the pages in the report by either clicking on the pages listed below, or by using the keyword search tool below to find specific information within the annual report.-
 1
1 -
2
-
3
-
4
-
5
-
6
-
7
-
8
-
9
-
10
-
11
-
12
-
13
-
14
-
15
-
16
-
17
-
18
-
19
-
20
-
21
-
22
-
23
-
24
-
25
-
26
-
27
-
28
-
29
-
30
-
31
-
32
-
33
-
34
-
35
-
36
-
37
-
38
-
39
-
40
-
41
-
42
-
43
-
44
-
45
-
46
-
47
-
48
-
49
-
50
-
51
-
52
-
53
-
54
-
55
-
56
-
57
-
58
-
59
-
60
-
61
-
62
-
63
-
64
-
65
-
66
-
67
-
68
-
69
-
70
-
71
-
72
-
73
-
74
-
75
-
76
-
77
-
78
-
79
-
 80
80 -
 81
81 -
 82
82 -
 83
83 -
 84
84 -
 85
85 -
 86
86 -
 87
87 -
 88
88 -
 89
89 -
 90
90 -
 91
91 -
 92
92 -
 93
93 -
 94
94 -
 95
95 -
 96
96 -
 97
97 -
 98
98 -
 99
99 -
 100
100 -
101
-
102
-
103
-
104
-
105
-
106
-
107
-
108
-
109
-
110
-
111
-
112
-
113
-
114
-
115
-
116
-
117
-
118
-
119
-
120
-
121
-
122
-
123
-
124
-
125
-
126
-
127
-
128
-
129
-
130
-
131
-
132
-
133
-
134
-
135
-
136
-
137
-
138
-
139
-
140
-
141
-
142
-
143
-
144
-
145
-
146
-
147
-
148
-
149
-
150
-
151
-
152
-
153
-
154
-
155
-
156
-
157
-
158
-
159
-
160
-
161
-
162
-
163
-
164
-
165
-
166
-
167
-
168
-
169
-
170
-
171
-
172
-
173
-
174
-
175
-
176
-
177
-
178
-
179
-
180
-
181
-
182
-
183
-
184
-
185
-
186
-
187
-
188
-
189
-
190
-
191
-
192
-
193
-
194
-
195
-
196
-
197
-
198
-
199
-
200
-
201
-
202
-
203
-
204
-
205
-
206
-
207
-
208
-
209
-
210
-
211
-
212
-
213
-
214
-
215
-
216
-
217
-
218
-
219
-
220
-
221
-
222
-
223
-
224
-
225
-
226
-
227
-
228
-
229
-
230
-
231
-
232
-
233
-
234
-
235
-
236
-
237
-
238
-
239
-
240
-
241
-
242
-
243
-
244
-
245
-
246
-
247
-
248
-
249
-
250
-
251
-
252
-
253
-
254
-
255
-
256
-
257
-
258
-
259
-
260
-
261
-
262
-
263
-
264
-
265
-
266
-
267
-
268
-
269
-
270
-
271
-
272
-
273
-
274
-
275
-
276
-
277
-
278
-
279
-
280
-
281
-
282
-
283
-
284
-
285
-
286
-
287
-
288
-
289
-
290
-
291
-
292
-
293
-
294
-
295
-
296
-
297
-
298
-
299
-
300
-
301
-
302
-
303
-
304
-
305
-
306
-
307
-
308
-
309
-
310
-
311
-
312
-
313
-
314
-
315
-
316
-
317
-
318
-
319
-
320
-
321
-
322
-
323
-
324
-
325
-
326
-
327
-
328
-
329
-
330
-
331
-
332
-
333
-
334
-
335
-
336
-
337
-
338
-
339
-
340
-
341
-
342
-
343
-
344
-
345
-
346
-
347
-
348
-
349
-
350
-
351
-
352
-
353
-
354
-
355
-
356
-
357
-
358
-
359
-
360
-
361
-
362
-
363
-
364
-
365
-
366
-
367
-
368
-
369
-
370
-
371
-
372
-
373
-
374
-
375
-
376
-
377
-
378
-
379
-
380
-
381
-
382
-
383
-
384
-
385
-
386
-
387
-
388
-
389
-
390
-
391
-
392
-
393
-
394
-
395
-
396
-
397
-
398
-
399
-
400
-
401
-
402
 |
 |

89
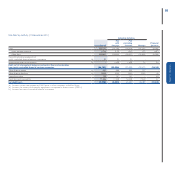
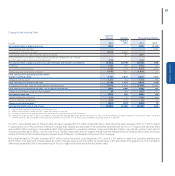
(*) In accordance with IFRS 5, figures for 2010 have been reclassified to reflect the demerger that took effect 1 January 2011
(a) Includes reversal of the net gain recognized in 2011 in relation to the Chrysler transaction of €2,017 million and reversal of unusual non-cash expense. The item also includes reversal
of a €110 million loss (€107 million gain for 2010) in the fair value of two equity swaps on a basket of Fiat S.p.A. and Fiat Industrial S.p.A. ordinary shares
(b) Cash from vehicles sold under buy-back commitments for the periods reported above, net of amounts already recognized through profit and loss, is included in a separate line item
under operating activities, which also includes the change in working capital
(c) Relates to the acquisition of ownership interests held by the U.S. Treasury (6.031% fully diluted) and the Canadian government (1.508% fully diluted) during 2011 for a consideration
of $500 million (€351 million) and $125 million (€87 million), respectively. The comparable amounts relating primarily to purchase of the 5% interest in Ferrari S.p.A. during 2010 were
reclassified accordingly
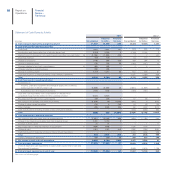
Industrial Activities
For 2011, Industrial Activities generated cash and cash equivalents totaling €5,724 million. Excluding €5,624 million in cash and cash equivalents
attributable to the consolidation of Chrysler (net of €881 million paid to Chrysler for a 16% ownership interest), change in cash for Industrial Activities totaled
€100 million.
Operating activities generated €5,184 million in cash, of which €1,751 million was attributable to Chrysler (consolidated from June 2011). Income-
related cash inflows (i.e., net profit plus amortization and depreciation, dividends, changes in provisions and various items related to vehicles sold under
buy-back commitments, net of gains/losses on disposals and other non-cash items) totaled €3,767 million and a decrease in working capital contributed
a further €1,417 million (at constant exchange rates).
Investing activities absorbed a total of €5,418 million in cash (excluding €5,624 million in cash from the consolidation of Chrysler), primarily for
investments in tangible and intangible assets and equity interests (€5,667 million) and an increase in funding provided to the Group’s financial services
companies by central treasury companies (included under other changes), which were only partially offset by the sale of non-current assets totaling €448
million.
Financing activities used €265 million in cash. Net debt repayments and disbursements for the purchase of the U.S. Treasury and Canada interests
in Chrysler (€438 million) and dividend payments (€181 million) were only partially offset by the €2.8 billion in cash received from Fiat Industrial Group in
January.
Financial Services
Cash and cash equivalents for Financial Services totaled €97 million at 31 December 2011, down €165 million over year-end 2010.
Changes in cash were attributable to:
Operating activities, which generated €55 million in cash, principally from income-related cash inflows (net profit plus amortization and depreciation).
Investing activities (including changes in financial receivables from/debt payable to industrial companies) which absorbed €1,064 million in cash,
primarily due to an increase in the lending portfolio net of funding from treasury companies (included under other changes).
Financing activities that generated a total of €853 million in cash, with a €895 million net increase in financing partially offset by dividends paid to
companies included under Industrial Activities.
Report on Operations