Chrysler 2011 Annual Report Download - page 173
Download and view the complete annual report
Please find page 173 of the 2011 Chrysler annual report below. You can navigate through the pages in the report by either clicking on the pages listed below, or by using the keyword search tool below to find specific information within the annual report.-
 1
1 -
2
-
3
-
4
-
5
-
6
-
7
-
8
-
9
-
10
-
11
-
12
-
13
-
14
-
15
-
16
-
17
-
18
-
19
-
20
-
21
-
22
-
23
-
24
-
25
-
26
-
27
-
28
-
29
-
30
-
31
-
32
-
33
-
34
-
35
-
36
-
37
-
38
-
39
-
40
-
41
-
42
-
43
-
44
-
45
-
46
-
47
-
48
-
49
-
50
-
51
-
52
-
53
-
54
-
55
-
56
-
57
-
58
-
59
-
60
-
61
-
62
-
63
-
64
-
65
-
66
-
67
-
68
-
69
-
70
-
71
-
72
-
73
-
74
-
75
-
76
-
77
-
78
-
79
-
80
-
81
-
82
-
83
-
84
-
85
-
86
-
87
-
88
-
89
-
90
-
91
-
92
-
93
-
94
-
95
-
96
-
97
-
98
-
99
-
100
-
101
-
102
-
103
-
104
-
105
-
106
-
107
-
108
-
109
-
110
-
111
-
112
-
113
-
114
-
115
-
116
-
117
-
118
-
119
-
120
-
121
-
122
-
123
-
124
-
125
-
126
-
127
-
128
-
129
-
130
-
131
-
132
-
133
-
134
-
135
-
136
-
137
-
138
-
139
-
140
-
141
-
142
-
143
-
144
-
145
-
146
-
147
-
148
-
149
-
150
-
151
-
152
-
153
-
154
-
155
-
156
-
157
-
158
-
159
-
160
-
161
-
162
-
 163
163 -
 164
164 -
 165
165 -
 166
166 -
 167
167 -
 168
168 -
 169
169 -
 170
170 -
 171
171 -
 172
172 -
 173
173 -
 174
174 -
 175
175 -
 176
176 -
 177
177 -
 178
178 -
 179
179 -
 180
180 -
 181
181 -
 182
182 -
 183
183 -
184
-
185
-
186
-
187
-
188
-
189
-
190
-
191
-
192
-
193
-
194
-
195
-
196
-
197
-
198
-
199
-
200
-
201
-
202
-
203
-
204
-
205
-
206
-
207
-
208
-
209
-
210
-
211
-
212
-
213
-
214
-
215
-
216
-
217
-
218
-
219
-
220
-
221
-
222
-
223
-
224
-
225
-
226
-
227
-
228
-
229
-
230
-
231
-
232
-
233
-
234
-
235
-
236
-
237
-
238
-
239
-
240
-
241
-
242
-
243
-
244
-
245
-
246
-
247
-
248
-
249
-
250
-
251
-
252
-
253
-
254
-
255
-
256
-
257
-
258
-
259
-
260
-
261
-
262
-
263
-
264
-
265
-
266
-
267
-
268
-
269
-
270
-
271
-
272
-
273
-
274
-
275
-
276
-
277
-
278
-
279
-
280
-
281
-
282
-
283
-
284
-
285
-
286
-
287
-
288
-
289
-
290
-
291
-
292
-
293
-
294
-
295
-
296
-
297
-
298
-
299
-
300
-
301
-
302
-
303
-
304
-
305
-
306
-
307
-
308
-
309
-
310
-
311
-
312
-
313
-
314
-
315
-
316
-
317
-
318
-
319
-
320
-
321
-
322
-
323
-
324
-
325
-
326
-
327
-
328
-
329
-
330
-
331
-
332
-
333
-
334
-
335
-
336
-
337
-
338
-
339
-
340
-
341
-
342
-
343
-
344
-
345
-
346
-
347
-
348
-
349
-
350
-
351
-
352
-
353
-
354
-
355
-
356
-
357
-
358
-
359
-
360
-
361
-
362
-
363
-
364
-
365
-
366
-
367
-
368
-
369
-
370
-
371
-
372
-
373
-
374
-
375
-
376
-
377
-
378
-
379
-
380
-
381
-
382
-
383
-
384
-
385
-
386
-
387
-
388
-
389
-
390
-
391
-
392
-
393
-
394
-
395
-
396
-
397
-
398
-
399
-
400
-
401
-
402
 |
 |

Consolidated
Financial
Statements
at 31 December
2011
Notes
172
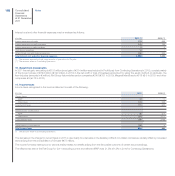
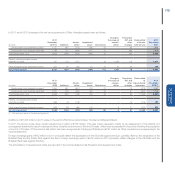
The recoverable amount of brands is tested annually and the Group recognises an impairment loss if the carrying amount of the brand exceeds its fair value.
For the purpose of impairment testing the Brands are allocated to the Chrysler cash-generating unit; the principal assumptions used in the calculation of
the value in use of this cash generating unit are discussed below.
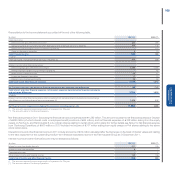
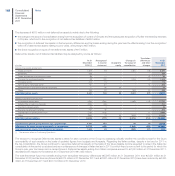
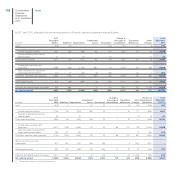
Goodwill
Goodwill is allocated to the Group’s cash-generating units that are expected to benefit from synergies of the business combination that generate it. The net
carrying amount of goodwill at 31 December 2011 is allocated as follows to different sectors.
(€ million) At 31 December 2011 At 31 December 2010 (*)
Chrysler 9,585 -
Ferrari 786 786
Components 51 121
Metallurgical Products 11 18
Fiat Group Automobiles 818
Fiat Powertrain 22
Production Systems -135
Goodwill 10,443 1,080
(*) The amounts relate to Continuing Operations.
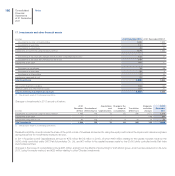
In accordance with IAS 36 goodwill is not amortised and is tested for impairment annually or more frequently if facts or circumstances occur that indicate
that the asset may be impaired. Impairment testing is performed by comparing the carrying amount and the recoverable amount of each cash-generating
unit to which goodwill has been allocated. The recoverable amount of a cash-generating unit is the higher of its fair value less costs to sell and its value in
use.
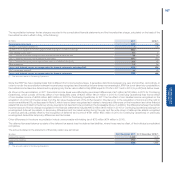
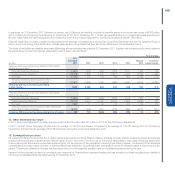
The goodwill generated from the acquisition of Chrysler, representing approximately 92% of the Group’s total goodwill at 31 December 2011, has been
allocated, together with the Brands, to the cash-generating unit corresponding to the Chrysler sector. The estimate of the cash-generating unit’s value in
use for this purpose is based on the following assumptions:
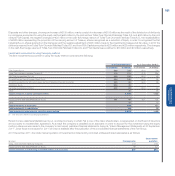
The expected future cash flows from Chrysler’s 2010-2014 business plan, which was made public on 4 November 2009, and expected future cash
flows for 2015 consistent with those projections. This business plan, whose 2010-2011 targets Chrysler has already achieved, and its further projection
to 2015, represent management’s best estimate of the future operating performance of the cash-generating unit during the period under consideration.
These expected future cash flows relate to the cash-generating unit in its current condition and exclude any estimate of future cash flows that may arise
from future restructuring plans or other structural changes.
The expected future cash flows have been estimated in U.S. dollars, namely the currency in which the cash flows will be generated, taking into
consideration the markets in which Chrysler principally operates, and then discounted using a discount rate appropriate for that currency.
The expected future cash flows cover a 4 year period and include a normalised terminal value used to indicate a synthetic estimate of future results
beyond the time period explicitly considered. Based upon the business environment in which Chrysler operates, a long-term growth rate of 2% to 3%
is considered reasonable. However, for purposes of estimating value in use in this context, the terminal value has been calculated using a conservative
long-term growth rate (g) assumption of 0%.
As a basic assumption, post-tax expected future cash flows are discounted at a 9.7% post-tax discount rate, which reflects the current market
assessment of the time value of money for the considered period and the risks specific to the cash-generating unit under consideration. The discount
rate was calculated by referring to the weighted average cost of capital determined using the Capital Asset Pricing Model (“CAPM”) technique in which
the risk free rate has been calculated by referring to the yield curve of long-term U.S. government bonds and the beta coefficient and the debt/equity
ratio have been extrapolated by analysing a group of comparable companies operating in the automotive sector. The Group also performed sensitivity
analyses compared to this basic assumption assuming various scenarios of increasing risk premiums. Even when the discount rate was increased from
9.7% to 13% and the 0% long-term growth rate assumption was maintained, the recoverable amount of the cash-generating unit still exceeded the
carrying amount.